Futures Single Prints 2026: TPO, Market Profile & Retest Guide
Futures Single Prints are non-extreme Time Price Opportunity levels that were visited during only one TPO period inside a Market Profile. They usually appear when price moved rapidly through an area without spending enough time there for a broader two-way auction to develop. That makes them useful references for studying imbalance, initiative activity and future retests. The mistake is treating every single-print zone as a guaranteed support, resistance or “fill” target. A better process asks where the zone formed, whether the move created genuine price acceptance elsewhere, how old the zone is and what order flow does when price returns.
Quick Answer
Futures Single Prints are TPO rows inside a completed profile that contain only one TPO block, meaning the market passed through those prices during one time bracket without later overlap in the same profile. TradingView describes them as non-extreme levels that can indicate market interest or imbalance and may become areas traders monitor on future retests. They are different from poor highs/lows at profile extremes and different from Volume Profile low-volume nodes. A high-quality setup requires context: identify the single-print zone, determine whether the auction was directional, wait for price to return, then judge acceptance, rejection and order-flow confirmation.
Explore NinjaTrader for footprint charts, order-flow analysis and futures simulation
Affiliate Disclosure: TradeboticsAI may earn compensation when an eligible user completes a qualifying action through an affiliate link, at no additional cost to the user. Affiliate relationships do not determine our editorial conclusions.

What Are Futures Single Prints?
Futures Single Prints are Market Profile/TPO price levels located inside the profile—not at the final high or low—where only one TPO period traded. TradingView’s current TPO documentation defines single prints as non-extreme levels containing only one TPO block. Because no later TPO period overlapped those prices during the same profile, the area records limited time acceptance.
A TPO chart organizes price vertically and time horizontally. Each time bracket—often configured as 30 minutes—marks every price row that traded during that bracket. When several periods trade the same price, several TPO blocks accumulate. When only one period traverses a row and later periods never overlap it, that row remains a single print.
The important word is time. A single print does not necessarily mean low contract volume. Thousands of contracts can trade quickly inside one time bracket and the row can still contain one TPO. This is why these TPO structures are not the same thing as Volume Profile low-volume nodes.
Official reference:
TradingView Time Price Opportunity documentation.
CME Group defines Market Profile more broadly as a method that organizes price and time to reveal where price is being accepted and rejected. Single prints fit naturally inside that auction framework because they identify prices where the market spent comparatively little time.
How Futures Single Prints Form
Futures Single Prints usually form during directional price movement. Imagine ES trades around 6,500.00 for several TPO periods. A new wave of buying then pushes price rapidly to 6,510.00. The auction passes through 6,503.00 to 6,506.00 during one bracket and never returns to those prices for the rest of the session.
Those interior rows can remain represented by one TPO block each. The profile now contains a thin structural area between more developed regions.
A simplified TPO sequence might look like:
6511.00     EFG
6510.75     DEFG
6510.50     DEFG
6510.25     CDEFG
6510.00     CDEFG
6509.75     CDE
6509.50     C
6509.25     C
6509.00     C
6508.75     C
6508.50     ABC
6508.25     ABCD
6508.00     ABCD
The rows containing only “C” are the potential single-print area. Price passed through during one TPO period and did not overlap those levels later in the completed profile.
This structure often appears during initiative movement, trend-day development, range expansion or repricing after new information. But the single-print pattern describes the profile structure, not the motive of the participants. The data does not prove whether the move came from institutions, retail traders, hedgers or algorithms.
Developing vs Confirmed Futures Single Prints
A developing profile can temporarily show a one-period row that later disappears when another TPO period trades back through it. For that reason, Futures Single Prints should not be treated as fully established the instant the first fast move occurs.
Suppose the C period creates a narrow one-TPO zone. During the next D period, price may return and overlap part or all of that area. Any rows revisited by D are no longer one-period rows in the completed profile.
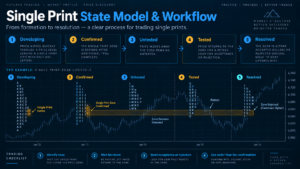
A disciplined workflow therefore separates:
- Developing single print: currently represented by one TPO period but still vulnerable to same-session overlap.
- Confirmed single print: remains a one-TPO non-extreme row after later profile development confirms the structure.
- Partially repaired zone: some rows have been revisited while others remain single prints.
- Fully repaired zone: later trade has overlapped the original zone so it no longer remains one-TPO structure in that profile.
This state-based view is more precise than drawing a line immediately and assuming the market has created permanent support or resistance.
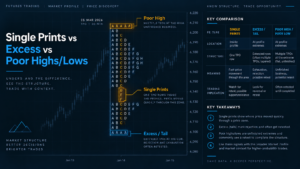
Futures Single Prints vs Excess
Futures Single Prints and excess both involve low time overlap, but their locations are different.
| Structure | Location | Auction Message |
|---|---|---|
| Single Print | Inside the profile, away from the final extreme | Fast traversal / limited time acceptance inside the auction |
| Excess / Tail | At the upper or lower profile extreme | The auction tested an extreme and rejected it |
TradingView explicitly defines single prints as non-extreme levels. That means a one-TPO tail at the very top or bottom should not be labeled the same way as an interior single-print zone when using this methodology.
This distinction also helps separate single-print zones from the poor-high/poor-low framework. A clean excess tail can indicate stronger rejection at an extreme, while a poor extreme lacks that decisive taper.
Futures Single Prints vs Poor Highs and Poor Lows
The previous TradeboticsAI guide covered Futures Poor Highs and Poor Lows 2026. The concepts are related but should not be merged.
| Feature | Single Print | Poor High / Poor Low |
|---|---|---|
| Location | Interior of profile | Profile extreme |
| TPO Count | One TPO block at a row | Multiple TPOs remain at extreme |
| Main Interpretation | Fast movement through price | Extreme ended without clear excess-style rejection |
| Future Question | Will price accept or reject the thin zone on retest? | Will the unfinished-looking extreme be explored further? |
Both structures are auction references. Neither creates a guaranteed future target or reversal.
Futures Single Prints vs Volume Profile Low-Volume Nodes
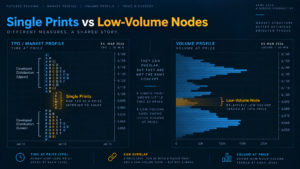
Futures Single Prints measure time-at-price structure. A Low-Volume Node measures contracts traded at price. They can overlap, but they are not mathematically equivalent.
Consider two prices:
- Price A traded for only one TPO period but processed 8,000 contracts during a high-speed event.
- Price B traded across three TPO periods but processed relatively little total volume.
Price A can be a single print without being the lowest-volume price. Price B can be a low-volume node without being a single print.
This difference creates useful information gain. TPO asks, “How long did the auction remain here?” Volume Profile asks, “How much business actually traded here?”
When both tools identify the same thin region, the zone may deserve closer attention because both time and volume show limited development. But traders should not assume the two always match.
See Futures Volume Profile 2026 for POC, VAH, VAL, HVN and LVN analysis.

Futures Single Prints and Initiative Activity
One reason traders watch Futures Single Prints is that they often appear during initiative movement—an auction pushing away from previously accepted value rather than rotating inside it.
Imagine ES opens inside prior value, trades there for an hour, then breaks above Value Area High. If one TPO period drives through several prices and later periods build a new distribution above the thin zone, the single prints visually separate the old auction from the new one.
This can be especially informative on a double-distribution or trend-style session. The thin area shows where price moved quickly, while the broader distributions show where time acceptance returned.
The correct interpretation is not “single prints always become support.” The more precise statement is: a directional auction passed through those prices quickly, and a future retest can reveal whether the market still rejects that area or is now willing to accept it.
This is why single-print analysis fits naturally inside Futures Auction Market Theory 2026 and Futures Market Profile 2026.
How to Read a Futures Single Prints Retest
The retest is where Futures Single Prints become most useful. Do not assume the first touch creates an automatic trade. Instead classify the auction response.
Scenario 1: Rejection From the Zone
Price returns to a prior bullish single-print zone from above. Sellers enter aggressively, but price stops progressing lower. A footprint shows negative delta being absorbed, and ES rotates back above the zone.
The historical single-print area has now attracted a fresh response. The trade thesis comes from the current rejection, not from the old profile alone.
Scenario 2: Acceptance Through the Zone
Price enters the zone, spends time there, volume develops and subsequent bars continue through it. The market is repairing the prior thin area and demonstrating current acceptance.
In that case, treating the old single print as permanent support or resistance would be a mistake.
Scenario 3: Partial Test
Price enters only part of the zone and then reverses. The untouched portion remains structurally untested by the new auction. Some traders continue tracking the remaining section, but the zone should be updated rather than treated as unchanged.
Scenario 4: Fast Traverse
Price crosses the entire zone quickly with little response. This suggests the historical reference is not currently attracting meaningful two-way trade. The next relevant level may be the distribution on the opposite side.
What Does a Futures Single Prints “Fill” Mean?
Trading discussions often say that Futures Single Prints “fill.” The term usually means future price revisits some or all of a prior single-print zone, causing the area to become overlapped by later trade from a broader historical perspective.
There are several useful states:
- Untested: price has not returned to the zone since it formed.
- Partially tested: price has entered only part of the zone.
- Fully traversed: price has traded through the entire zone.
- Accepted: meaningful time and/or volume develops inside the area.
- Rejected: price probes the zone and quickly moves away.
“Filled” should not automatically mean “trade complete” or “reverse now.” A full traverse can be the start of deeper acceptance rather than the end of a move.
TradingView’s official documentation uses cautious language: single prints can be monitored as potential levels that price might revisit and as possible support or resistance. That is materially different from claiming they must fill.
TradeboticsAI Futures Single Prints State Model
TradeboticsAI uses a five-state framework so Futures Single Prints are tracked as evolving auction structures rather than static horizontal boxes.
| State | Definition | What to Watch |
|---|---|---|
| 1. Developing | One TPO currently owns the rows, but the profile is still forming | Later same-session overlap |
| 2. Confirmed | Completed profile still contains one-TPO interior rows | Origin, direction, width and surrounding distributions |
| 3. Untested | Later sessions have not revisited the zone | First future approach and broader context |
| 4. Tested | Price enters some or all of the zone | Acceptance, rejection, footprint and delta |
| 5. Resolved | Current auction clearly accepts through or rejects from the area | New value formation or confirmed rejection structure |
This state model adds something a generic Market Profile definition does not: it specifies how the reference should evolve through time. An old zone that has been heavily accepted is not equivalent to a fresh, untested one.
It also prevents a common form of chart clutter. Instead of keeping every historical single-print zone forever, traders can archive or de-emphasize zones that the market has clearly resolved.
Practical Futures Single Prints Example: ES Trend Day
Assume ES opens near 6,500.00 and spends the first hour rotating between 6,497.00 and 6,503.00. The market then breaks above 6,503.00 during the C period and rapidly trades to 6,512.00.
The C period passes through 6,504.00 to 6,507.00. Later periods D, E and F remain above 6,507.00 and build a second distribution around 6,510.00 to 6,514.00.
The completed profile now contains a Futures Single Prints zone between the lower balance area and the higher accepted distribution.
Next-Session Retest
The following session opens above the zone and later sells toward 6,507.00. Three outcomes are possible:
- Rejection: sellers hit bids inside the zone, but price cannot progress lower. Negative delta is absorbed and ES returns above 6,508.00.
- Acceptance: price spends multiple bars inside the zone, volume increases and ES continues toward the old lower distribution.
- Partial test: price trades only into the top half of the zone before reversing.
The historical profile tells us where the prior auction moved quickly. The current auction determines whether that information still matters.
This example also shows why these zones are more useful when combined with the surrounding distributions rather than traded as isolated lines.
Order Flow Confirmation for Futures Single Prints
TPO identifies the historical zone. Order flow can help evaluate the current retest of Futures Single Prints.
Footprint Charts
A footprint shows whether aggressive buyers or sellers are active inside the zone and whether their aggression produces price progress. Strong negative delta with no downside movement can indicate passive buying; strong positive delta with no upside progress can indicate passive selling.
See Futures Footprint Charts 2026.
Volume Delta
Futures Volume Delta 2026 helps measure the net aggressive effort during the retest. The sign of delta is not enough; compare it with price response.
Cumulative Delta
CVD can reveal whether broader aggressive flow supports the move through the zone or diverges from price. It is context rather than proof.
Absorption and Trapped Traders
If aggressive selling enters a bullish single-print zone but price refuses to break through, absorption can strengthen a rejection thesis. If a breakdown through the zone fails and recent shorts are forced back above it, trapped-trader analysis can add another layer.
Liquidity Sweep Context
A retest can also coincide with a Futures Liquidity Sweep around an adjacent prior high or low. The key is to avoid stacking labels without purpose: each concept should answer a different question.
Explore NinjaTrader Order Flow+ tools and practice retest analysis in simulation
Practical Futures Single Prints Trading Workflow
- Use a consistent session definition. RTH and ETH profiles can create different zones.
- Standardize TPO period length and row size. Changing settings changes the profile.
- Wait for profile confirmation. Do not assume a developing one-TPO area will survive later same-session overlap.
- Mark only non-extreme one-TPO rows. Keep excess tails and poor highs/lows classified separately.
- Record direction and origin. Note whether the zone formed during a breakout, trend day, news repricing or ordinary range expansion.
- Track the state. Developing, confirmed, untested, tested or resolved.
- Wait for a future approach. Do not trade simply because the historical zone exists.
- Read current auction response. Look for acceptance, rejection, absorption or clean traverse.
- Use order flow selectively. Footprint or delta can confirm what is happening during the test.
- Define invalidation before entry. A zone that becomes accepted should not be defended indefinitely.
This workflow makes Futures Single Prints a structured Market Profile reference rather than a belief that every thin area must be filled or defended.
Common Futures Single Prints Mistakes
1. Calling an Extreme Tail a Single Print
TradingView defines single prints as non-extreme one-TPO rows. A tail at the final high or low belongs to excess analysis.
2. Assuming Every Zone Must Fill
Futures Single Prints can be revisited, but there is no rule forcing price to return within a specific period—or at all.
3. Assuming Every Retest Must Reverse
Price can accept through the entire area and continue into the next distribution. The historical zone is a reference, not a guaranteed wall.
4. Confusing Time With Volume
One TPO does not necessarily mean low transaction volume. TPO counts time periods; Volume Profile counts traded contracts.
5. Ignoring Session Settings
A zone visible on an RTH profile may not appear on an ETH profile. Keep the methodology consistent.
6. Trading Developing Structure Too Early
A later TPO period can revisit the rows and remove the single-print condition before the profile is complete.
7. Keeping Old Zones Forever
A heavily accepted historical area may no longer provide useful information. Update the zone state after retests.
8. Using Unsupported Probability Claims
A universal fill rate cannot be assumed without a clearly defined instrument, session, TPO settings, zone definition, sample period and testing method.
Pros and Limitations of Futures Single Prints
Pros
- Provides an objective time-at-price structure.
- Highlights fast directional movement inside a profile.
- Can separate accepted distributions from thin auction zones.
- Creates clear future retest references.
- Combines well with Auction Market Theory and order flow.
- Can be tracked systematically through defined states.
Limitations
- No revisit or fill is guaranteed.
- TPO settings affect zone identification.
- Single prints measure time, not actual transaction volume.
- Historical zones can lose relevance.
- Retests can accept straight through the zone.
- Order-flow confirmation still produces false signals.
Best For
Futures Single Prints are most useful for intraday futures traders already using Market Profile, TPO, Auction Market Theory or order-flow tools and looking for a structured way to track fast one-sided auction zones.
Not Ideal For
They are not ideal for traders seeking automatic buy/sell signals, anyone expecting guaranteed fills, or strategies where detailed intraday time-at-price structure adds little value.
Futures Single Prints FAQ
What are Futures Single Prints?
Futures Single Prints are non-extreme TPO price rows containing only one TPO block in a completed Market Profile, indicating that only one time period traded those prices.
What do single prints mean in Market Profile?
They show that the auction moved through an interior price area quickly enough that later TPO periods did not overlap those rows during the same profile.
Are single prints the same as low-volume nodes?
No. Single prints measure limited time overlap. Low-volume nodes measure relatively low traded volume. The two can overlap but are calculated differently.
Are single prints the same as excess?
No. Under TradingView’s TPO definition, single prints are non-extreme levels. Excess or tails occur at profile extremes and represent a different auction structure.
Are single prints the same as poor highs and poor lows?
No. Poor highs/lows occur at profile extremes and contain multiple TPO blocks without clear tapering. Futures Single Prints occur inside the profile and contain one TPO block at each qualifying row.
Do single prints always get filled?
No. TradingView describes them as levels traders may monitor for possible revisits or support/resistance. A future fill is not guaranteed.
What is a single-print fill?
It generally means future price revisits part or all of a prior one-TPO zone. A full traverse does not automatically imply reversal.
Can single prints act as support or resistance?
They can become reaction zones on a retest, but current price behavior must confirm the response. A zone can also be accepted through without meaningful rejection.
When is a developing single print confirmed?
The practical confirmation comes when later TPO periods fail to overlap the qualifying interior rows and the profile preserves the one-TPO structure.
Why do single prints form?
They often form during fast directional auctions, initiative activity, breakouts or repricing where price spends little time at intermediate levels.
Can footprint charts confirm a single-print retest?
Yes. A footprint can show whether aggressive buying or selling succeeds, becomes absorbed or fails as price enters the zone.
What is the best TPO period for single prints?
Thirty-minute TPO brackets are common in traditional Market Profile workflows, but platforms may allow customization. Consistency matters more than changing settings to improve historical appearance.
Can Futures Single Prints predict price?
No. Futures Single Prints identify historical time-at-price structure. Future liquidity, information and participation determine whether the zone is respected, repaired or ignored.
Final Verdict: How to Use Futures Single Prints Correctly
Futures Single Prints are valuable because they identify interior Market Profile prices where the auction moved quickly enough to leave only one TPO period behind.
The concept is simple, but the interpretation should remain disciplined. A single print does not mean low volume, does not guarantee a future fill and does not automatically create support or resistance.
The strongest TradeboticsAI process is:
identify one-TPO interior structure → confirm the completed zone → classify its origin → track its state → wait for a retest → judge acceptance or rejection → use order flow for confirmation → manage risk.
Use Futures Single Prints alongside Futures Market Profile, Auction Market Theory, Poor Highs and Poor Lows, Volume Profile, Volume Delta and Futures Order Flow Trading.
The objective is not to predict that every thin TPO zone must be repaired. It is to identify where the market previously moved with limited time acceptance and then let the current auction prove whether those prices still matter.
Explore NinjaTrader for footprint charts, order-flow tools and futures simulation
Affiliate Disclosure: TradeboticsAI may receive compensation when eligible users complete a qualifying action through certain affiliate links. Affiliate relationships do not determine our editorial conclusions.
Risk Disclosure: Futures trading involves substantial risk of loss and is not suitable for every investor. Market Profile, TPO single prints, footprint charts, Volume Delta, Cumulative Delta and historical auction structure do not predict future returns. A historical single-print zone may be rejected, accepted, partially tested or ignored, and simulated results do not guarantee future live performance. Nothing on this page is personalized investment, financial, tax or trading advice.