Futures Liquidity Sweep 2026: Stop Runs, Failed Breakouts & Order Flow Guide
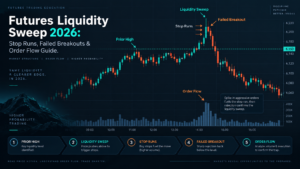
Futures Liquidity Sweep is a trader term for a short-lived move through an obvious high, low or range boundary where stop orders and breakout orders can become active before price either rejects the area or continues into genuine price discovery. The critical point is that a sweep is not automatically a reversal and does not prove that an institution deliberately “hunted” anyone’s stop. A better framework combines official futures order mechanics with market structure, executed volume, footprint data, Cumulative Delta, DOM behavior and the market’s response after the level is broken.
Quick Answer
Futures Liquidity Sweep usually describes price trading through a clearly watched level—such as the prior-day high, prior-day low, overnight extreme or range boundary—before quickly returning through it. Stops triggered beyond the level can add aggressive order flow, while breakout traders may enter at the same time. The event becomes more meaningful when the market fails to build acceptance beyond the level and order-flow data shows absorption, exhaustion or trapped aggression. A move through a level that holds and builds new value is more consistent with a genuine breakout than a failed sweep.
Explore NinjaTrader for futures DOM, footprint charts and simulated order-flow analysis
Affiliate Disclosure: TradeboticsAI may earn compensation when an eligible user completes a qualifying action through an affiliate link, at no additional cost to the user. Affiliate relationships do not determine our editorial conclusions.
What Is a Futures Liquidity Sweep?
A Futures Liquidity Sweep is not an official CME order type. It is trading terminology used to describe a price move through an obvious reference where stop orders, breakout entries and other conditional orders may become active.
Common examples include price briefly trading above a prior session high before returning below it, or moving beneath a well-defined low before quickly reclaiming the range.
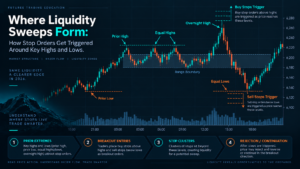
The word “liquidity” is used because these areas can contain potential transactions. A trader who is short may have a protective buy stop above a recent high. Another trader may have a buy-stop entry designed to participate in a breakout. When the trigger price is reached, these orders can become executable according to their order type.
However, traders should avoid the simplistic narrative that price moves because one identifiable institution intentionally knows where every retail stop sits. Stop orders are not generally visible as ordinary resting limit-order depth before activation, and an outside trader cannot directly observe the complete distribution of other participants’ stop instructions.
The useful observation is simpler: widely watched highs and lows often become areas where order flow changes quickly once price trades through them.
Futures Liquidity Sweep Mechanics: How Stop Orders Actually Work
Understanding stop orders makes Futures Liquidity Sweep analysis more precise. CME Group explains that a stop order does not immediately enter the ordinary order book when accepted. It must first be triggered by qualifying market activity at the designated stop price.
Once triggered, behavior depends on the order type.
| Order Type | Before Trigger | After Trigger | Main Risk |
|---|---|---|---|
| Stop With Protection | Conditional stop instruction | Becomes marketable within the exchange protection range | Execution may differ from trigger price |
| Stop-Limit | Conditional stop instruction | Becomes a limit order | May remain unfilled if price moves through the limit |
This matters because a cluster of triggered buy stops above a high can create aggressive demand at the same time breakout buyers are entering. A cluster of sell stops below a low can create aggressive supply.
A Futures Liquidity Sweep therefore often produces a temporary acceleration in transaction activity. But the next question is what happens after those orders execute.
Official reference:
CME Group Futures Order Types.

Where Futures Liquidity Sweeps Commonly Develop
A Futures Liquidity Sweep is easier to evaluate when the reference level existed before the move. Randomly labeling every wick a sweep creates hindsight bias.
Common pre-defined locations include:
- prior-day high and low;
- overnight high and low;
- weekly high and low;
- Initial Balance high and low;
- clear swing highs and lows;
- equal or nearly equal highs/lows;
- previous breakout boundaries;
- Value Area High and Value Area Low;
- major session ranges;
- highly visible round-number zones.
Not all levels contain the same amount of executable interest. The trader cannot see a complete map of every stop. Instead, these levels are useful because many market participants can independently observe them.
The more objective the reference, the easier it becomes to test whether a Futures Liquidity Sweep actually failed or whether the market successfully accepted beyond the boundary.
Futures Liquidity Sweep vs Genuine Breakout
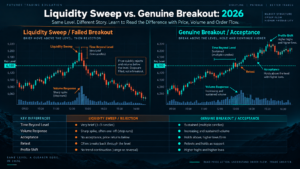
The most important distinction is not whether price traded beyond a level. Both a sweep and a successful breakout do that. The distinction appears afterward.
| Evidence | Liquidity Sweep / Failed Break | Genuine Breakout / Acceptance |
|---|---|---|
| Time Beyond Level | Brief | Sustained |
| Price Response | Rapid return through broken level | Holds outside prior range |
| Volume | Burst of activity without sustained progress | Activity develops at new prices |
| Profile | Little value builds outside range | Developing value migrates beyond range |
| Retest | Broken level fails and becomes reclaim point | Former boundary holds from the other side |
A Futures Liquidity Sweep should therefore be identified from rejection, not merely penetration.
If ES trades five ticks above yesterday’s high and continues another twenty points while the developing Volume Profile migrates higher, calling the original break a stop run simply because stops probably triggered there provides little analytical value.
If ES trades above the high, prints aggressive buying, fails to make further progress and rapidly closes back below, the failed auction deserves more attention.
Futures Liquidity Sweep Order Flow Confirmation
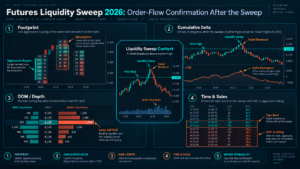
Price structure identifies the potential Futures Liquidity Sweep. Order-flow tools can help determine what happened during and immediately after the break.
Footprint Chart
A footprint can show whether large aggressive buying occurred above a high or aggressive selling occurred beneath a low. Strong aggression followed by little additional price progress can indicate that the breakout side is becoming less effective.
Cumulative Delta
CVD can show aggressive pressure continuing while price stops responding. For example, CVD may make a new high during a breakout above prior resistance while ES quickly falls back through the level.
Time & Sales
Tape data shows actual completed transactions. It can reveal whether the break generated a temporary burst of large or rapid executions and whether those transactions produced continued movement.
DOM / Level 2
Market depth can show resting liquidity around the area, but displayed orders can change or disappear. DOM data should therefore confirm execution context rather than replace actual transaction data.
Use Futures Order Flow Trading 2026, Futures Footprint Charts 2026, Futures Cumulative Delta 2026 and Futures Time and Sales 2026 for the individual tools.
Absorption, Exhaustion and Trapped Traders After a Futures Liquidity Sweep
Three behaviors often help explain why a Futures Liquidity Sweep reverses.
Absorption
Aggressive traders continue buying above a high or selling below a low, but passive liquidity accepts those transactions without allowing continued progress.
Exhaustion
The aggressive side runs out of participation after reaching the new extreme. Instead of heavy flow being absorbed, transaction activity simply fades.
Trapped Traders
Breakout traders enter beyond the level but the market immediately returns inside the old range. If those positions begin exiting, their liquidation can reinforce movement in the opposite direction.
These concepts are related but should not be merged into one generic reversal signal. A Futures Liquidity Sweep can reverse because of absorption, exhaustion, changing liquidity or a combination of factors.
See Futures Absorption Trading 2026 for the complete effort-versus-result framework.
Futures Liquidity Sweep, DOM and Hidden Liquidity
Visible market depth can help explain the environment around a Futures Liquidity Sweep, but traders should understand its limitations.
CME research emphasizes that displayed order-book depth by itself is not a complete measure of liquidity. During periods of high transaction velocity, liquidity can refresh rapidly even when static depth appears lower.
Hidden or iceberg liquidity can also cause far more contracts to execute at a price than were initially displayed.
This means the trader should avoid two assumptions:
- a large visible order guarantees that the level will hold;
- a thin visible book means there is no effective liquidity available.
For deeper market-depth mechanics, use Futures Market Liquidity 2026, Futures Level 2 Data 2026 and Futures Iceberg Orders 2026.
Official reference:
CME Group: Reassessing Liquidity Beyond Order Book Depth.
Futures Liquidity Sweep Through Auction Market Theory
Auction Market Theory provides one of the cleanest ways to interpret a Futures Liquidity Sweep.
Price moves beyond an accepted area and tests a new region. The question is whether the market finds enough participation to build new value.
If the market quickly returns into the previous auction, the excursion was rejected. If trade develops outside the prior area, the market is demonstrating acceptance and price discovery.
This eliminates the need to guess whether a move was “manipulation.” The observable test is simply:
Did the market accept or reject the new prices?
A prior-day high can therefore produce either a successful breakout or a Futures Liquidity Sweep. The historical level is identical. The subsequent auction decides the interpretation.
See Futures Auction Market Theory 2026, Futures Market Profile 2026 and Futures Volume Profile 2026.
TradeboticsAI Futures Liquidity Sweep Quality Matrix
TradeboticsAI uses the following framework to separate a meaningful sweep from a random wick. It is an editorial analysis framework, not a mechanical trading signal.
| Factor | Low Quality | Medium Quality | Higher Quality |
|---|---|---|---|
| Reference Level | Random intraday price | Visible local swing | Prior-day / overnight / weekly extreme or major profile level |
| Break | Minimal penetration | Clear excursion | Clear break with meaningful transaction activity |
| Acceptance | Market remains outside | Mixed | Rapid failure to build value outside |
| Order Flow | No useful confirmation | Some slowing | Absorption, exhaustion or trapped aggression |
| Reclaim | No return through level | Temporary return | Clear reclaim and follow-through inside old auction |
The matrix prevents a common error: defining the event only because price produced a wick. A higher-quality Futures Liquidity Sweep needs a pre-defined level, a break, failed acceptance and a meaningful response.
Practical Futures Liquidity Sweep Example: ES Prior-Day High
Assume the prior-day ES high is 6,520.00. During the next regular session, ES trades from 6,510.00 toward that level.
At 6,520.00, price accelerates and trades to 6,522.00. Footprint data shows strongly positive delta above the prior high as aggressive buyers enter.
If price continues to 6,528.00, the developing POC shifts above 6,520.00 and pullbacks hold over the old high, the market is demonstrating acceptance. Calling this a Futures Liquidity Sweep reversal would be premature.
Now consider a different sequence.
- Price trades from 6,520.00 to 6,522.00.
- Positive delta increases sharply.
- Buyers execute heavily at 6,521.50 and 6,522.00.
- Price cannot trade meaningfully higher.
- CVD makes a new high while price stalls.
- ES quickly trades back below 6,520.00.
- The retest of 6,520.00 from below fails.
This is a much stronger Futures Liquidity Sweep hypothesis. The breakout attracted aggressive buying, but the auction failed to build acceptance above the prior high.
The example does not prove someone intentionally targeted stop orders. It demonstrates an observable failed breakout where newly activated buying was unable to sustain higher prices.
A Practical Futures Liquidity Sweep Trading Workflow
- Mark levels before price reaches them. Prior highs/lows, overnight extremes and profile boundaries should already be known.
- Wait for an actual break. Do not anticipate a sweep before price trades through the level.
- Observe transaction intensity. Use footprint, delta or tape to see whether aggressive orders activate.
- Test acceptance. Ask whether time and volume are building outside the prior range.
- Look for failed progress. Strong aggression with little additional movement can indicate absorption or exhaustion.
- Wait for the reclaim. A return through the original boundary provides stronger evidence than the wick alone.
- Use profile context. Developing value that remains outside the old range weakens the reversal thesis.
- Define invalidation. If price reclaims the swept extreme and accepts beyond it, the failed-break thesis may no longer be valid.
- Size risk independently. A clean-looking setup does not justify oversized leverage.
- Review both failures and successes. Build statistics rather than remembering only dramatic reversals.
This workflow treats a Futures Liquidity Sweep as an information event first and a possible trade setup second.
Explore NinjaTrader for footprint, DOM, CVD and futures simulation
Why Futures Liquidity Sweep Setups Fail
1. The Breakout Is Genuine
The most obvious failure occurs when traders assume every move beyond a prior extreme must reverse. Sometimes the market is simply discovering new value.
2. The Reclaim Is Too Weak
A brief return through the level without follow-through can become another breakout attempt rather than a confirmed Futures Liquidity Sweep.
3. News Changes Fair Value Quickly
Economic releases and unexpected events can cause rapid repricing. Previous levels may temporarily lose relevance.
4. Order Flow Is Misread
Large positive delta above a high is not automatically bearish. It becomes interesting only if buyers fail to produce progress.
5. The Trader Assumes Hidden Intent
Claims that “smart money hunted the stops” cannot normally be proven from ordinary retail market data. Focus on observable behavior instead.
6. The Level Was Chosen After the Event
Drawing a line after price reverses makes almost any move look like a sweep. Define reference levels before the test.
7. The Trader Enters Before Rejection
Trying to fade the first tick through a high or low can place the trader directly against a strong trend breakout.
8. Risk Is Too Large
No Futures Liquidity Sweep pattern guarantees reversal. Position sizing must assume that the breakout can continue.
Pros and Limitations of Futures Liquidity Sweep Analysis
Pros
- Creates a structured framework for failed breakouts.
- Works naturally with prior highs, lows and profile levels.
- Combines well with footprint, CVD, DOM and tape.
- Provides clear acceptance/rejection logic.
- Can identify trapped breakout activity.
- Encourages waiting for confirmation rather than predicting turns.
Limitations
- Stop locations are not completely visible beforehand.
- Not every break of a high or low is a sweep.
- Intent behind market movement cannot normally be identified.
- Breakout acceptance can develop rapidly.
- Fast news conditions can create substantial slippage.
- Order-flow confirmation still produces false signals.
Best For
Futures Liquidity Sweep analysis is best suited to intraday traders already comfortable with market structure who want a disciplined way to distinguish failed breaks from accepted breakouts.
Not Ideal For
It is not ideal for traders looking for an automatic reversal signal, anyone who assumes every stop trigger is manipulation, or traders unwilling to wait for market confirmation.
Futures Liquidity Sweep FAQ
What is a Futures Liquidity Sweep?
A Futures Liquidity Sweep is trading terminology for a move through an obvious price level where stop and breakout orders may become active before the market either rejects or accepts the new prices.
Is a liquidity sweep the same as a stop run?
The terms are often used similarly in trading discussions. “Stop run” emphasizes triggered stops, while “liquidity sweep” usually describes the full move beyond a visible level and the subsequent market response.
Are stop orders visible in the DOM before they trigger?
Ordinary stop orders are conditional instructions rather than normal displayed resting limit orders before activation. Therefore, a trader cannot simply look at standard DOM depth and see every protective stop waiting beyond a high or low.
Does every move above a prior high count as a liquidity sweep?
No. A successful breakout also trades through the prior high. A Futures Liquidity Sweep reversal becomes more credible when price fails to build acceptance and returns through the level.
How do you confirm a liquidity sweep?
Useful confirmation can include failure to build volume outside the range, rapid reclaim of the level, absorption, exhaustion, CVD disagreement, trapped aggression or a failed retest.
What is the difference between a sweep and a breakout?
A sweep generally fails to sustain trade beyond the reference level. A genuine breakout develops acceptance, continued transaction activity and often new value outside the previous range.
Can footprint charts identify liquidity sweeps?
Footprints can show whether aggressive breakout activity occurred and whether that aggression successfully moved price. They cannot prove the location of every stop or the intent of other market participants.
Is Cumulative Delta useful after a sweep?
Yes. CVD can highlight aggressive pressure that is no longer producing proportional price progress. Divergence is context, not a guaranteed reversal signal.
Can an iceberg order cause a failed breakout?
Hidden or replenishing liquidity can contribute to absorption near an extreme, but a trader does not need to prove an iceberg exists to identify failed price acceptance.
Is a liquidity sweep market manipulation?
Not necessarily. A price move through a high or low does not prove manipulation. Legitimate market orders, stop activation, hedging, liquidity changes and ordinary price discovery can all contribute to the move.
Where do liquidity sweeps commonly occur?
Common locations include prior-day highs/lows, overnight extremes, weekly extremes, Initial Balance boundaries and other clearly visible market-structure levels.
Should traders enter immediately when a high is swept?
No universal rule exists. Waiting for rejection, reclaim and order-flow confirmation can reduce the risk of fading a genuine breakout.
Final Verdict: How to Use Futures Liquidity Sweep Correctly
Futures Liquidity Sweep analysis is most useful when it removes mythology rather than adding it. Traders do not need to assume that an invisible institution deliberately targeted their individual stop in order to understand a failed breakout.
Official futures mechanics explain that stop orders can become active when their trigger price is reached. Obvious highs and lows can therefore become areas of rapidly changing order flow. What happens afterward determines whether the move represented temporary rejection or genuine price discovery.
The strongest sequence is:
pre-defined level → break → triggered/aggressive flow → failed progress → rejection → reclaim → confirmation.
If price instead holds outside the previous range and builds new value, the market is showing acceptance and the sweep-reversal thesis weakens.
Combine Futures Liquidity Sweep analysis with Auction Market Theory, Order Flow Trading, Absorption, Footprint Charts and Market Liquidity. The objective is not to predict where every stop sits—it is to determine whether the market accepted or rejected the prices reached after an important level was broken.
Explore NinjaTrader for futures order flow, market depth and simulation tools
Affiliate Disclosure: TradeboticsAI may receive compensation when eligible users complete a qualifying action through certain affiliate links. Affiliate relationships do not determine our editorial conclusions.
Risk Disclosure: Futures trading involves substantial risk of loss and is not suitable for every investor. Liquidity sweeps, stop runs, footprint patterns, Cumulative Delta, DOM behavior, absorption and failed-breakout analysis do not predict future returns. Stop and market orders may experience execution differences during fast markets, and simulated results do not guarantee future live performance. Nothing on this page is personalized investment, financial, tax or trading advice.