Futures Volume Profile 2026: POC, VAH, VAL & Trading Guide
Futures Volume Profile shows how much trading volume occurred at each price level instead of only showing how much volume traded during each time interval. That difference helps futures traders identify where business concentrated, where price moved quickly, and how levels such as the Point of Control (POC), Value Area High (VAH), Value Area Low (VAL), High Volume Nodes (HVN), and Low Volume Nodes (LVN) fit into market structure.
Quick Answer
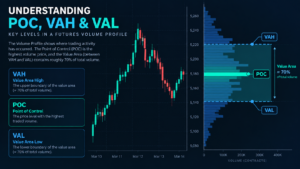
Futures Volume Profile is a volume-at-price study. The POC is the price level with the largest amount of profile data, while the value area is the range containing a chosen percentage of the profile’s volume. NinjaTrader documents a configurable value area that defaults to 68%, whereas other platforms may use a different default such as 70%. VAH and VAL mark the upper and lower boundaries of that value area. These levels provide context, not guaranteed support, resistance, or trade signals.
Explore NinjaTrader for futures charting, simulation and Order Flow tools
Affiliate Disclosure: TradeboticsAI may earn compensation when an eligible user completes a qualifying action through an affiliate link, at no additional cost to the user. Affiliate relationships do not determine our editorial conclusions.
What Does Futures Volume Profile Show?
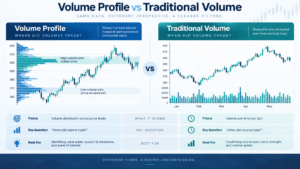
Futures Volume Profile plots trading activity horizontally at the prices where transactions occurred. Traditional volume bars answer a time-based question: how many contracts traded during this bar, minute, hour, or session? Volume Profile asks a different question: at which prices did those contracts trade?
NinjaTrader describes its Order Flow Volume Profile as a volume-at-price study that can be displayed as an indicator or drawing tool. Its documentation also distinguishes Volume Profile from Price Profile and Tick Profile. Volume Profile uses traded volume, Price Profile emphasizes whether trading occurred during defined time windows, and Tick Profile counts trades regardless of trade quantity.
That distinction matters because volume-at-price analysis is not simply a rotated version of a time-based histogram. It changes the analytical perspective from when activity occurred to where activity occurred.
Official documentation:
NinjaTrader Order Flow Volume Profile.
Futures Volume Profile POC, VAH and VAL Explained
Three labels appear repeatedly in Futures Volume Profile analysis: POC, VAH and VAL. They are useful only if the trader understands how the profile and value area were calculated.
| Level | Meaning | Practical Use | Main Limitation |
|---|---|---|---|
| POC | Price level with the largest data point / highest traded volume in the selected profile | Highlights the profile’s strongest concentration of activity | Can migrate as new trades are added |
| VAH | Upper boundary of the calculated value area | Frames the upper edge of the selected high-activity region | Depends on profile settings and value-area percentage |
| VAL | Lower boundary of the calculated value area | Frames the lower edge of the selected high-activity region | Not guaranteed support |
NinjaTrader’s documentation defines the POC as the single largest data point in the profile. It defines the value area as the range containing a configurable percentage of traded volume and documents a 68% default. This is important because many traders assume every platform uses the same value-area percentage. That assumption can produce slightly different VAH and VAL levels across software.
A useful rule is therefore: never discuss a Futures Volume Profile level without knowing the profile period, session template, data resolution, ticks-per-level aggregation, and value-area percentage used to create it.

High Volume Nodes and Low Volume Nodes
A Futures Volume Profile usually contains bulges and thin areas rather than a perfectly smooth distribution. Traders commonly call these High Volume Nodes and Low Volume Nodes.
High Volume Nodes (HVN)
An HVN is an area where relatively large volume accumulated across nearby price levels. NinjaTrader educational material describes high-volume areas as locations where substantial transactions occurred and notes that traders often watch them when price revisits the zone.
Conceptually, an HVN can indicate an area where the market previously found enough two-sided participation to conduct substantial business. That does not mean the level must hold. New information, different liquidity conditions or a strong directional move can push price through an old node without hesitation.
Low Volume Nodes (LVN)
An LVN is a thin part of the profile where comparatively little volume traded. NinjaTrader notes that these areas can accompany fast price movement because the market spent relatively little activity there.
The key distinction is contextual: an HVN represents concentration, while an LVN represents relative rejection or low participation in the selected sample. Neither is an automatic entry signal.
Futures Volume Profile vs Traditional Volume Bars
Traditional volume and Futures Volume Profile use the same broad concept—traded volume—but organize it differently.
| Tool | Primary Axis | Main Question | Typical Insight |
|---|---|---|---|
| Traditional Volume | Time | When was activity high? | Participation during a bar/session |
| Volume Profile | Price | Where did activity occur? | Concentration, value area and thin zones |
| Footprint / Volumetric Bars | Price within bars | How was volume distributed at bid/ask inside each bar? | Order-flow imbalance and delta context |
This is why a trader can use several tools together without them being redundant. Traditional volume can show a breakout occurred on elevated participation, while Futures Volume Profile can show whether the breakout left a thin LVN behind or moved into a prior high-volume area.
For related platform research, see our Best Futures Trading Platforms 2026 guide and NinjaTrader Review 2026.
Session, Composite and Custom Futures Volume Profiles
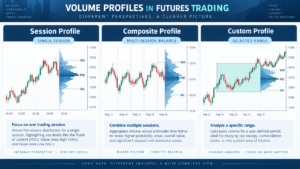
The period used to construct a Futures Volume Profile can materially change what the chart shows. A session profile answers a different question from a weekly, monthly or custom composite profile.
Session Profile
A session profile isolates volume-at-price for a defined trading session. This is useful for comparing today’s developing value with a prior session, but the result depends on the trading-hours template. A profile based on regular trading hours can differ significantly from one based on the full electronic session.
Composite Profile
A composite profile combines a broader range of data into one distribution. Traders may use it to study a multi-day balance area, a trend leg or a longer auction range. NinjaTrader’s Order Flow Volume Profile supports composite construction and custom drawing ranges.
Custom / Fixed Range Profile
A manually selected range can isolate a specific event, breakout, swing or consolidation. The advantage is analytical precision; the risk is hindsight bias. If the trader changes the start and end points until the desired conclusion appears, the profile loses objectivity.
Document the profile definition before interpreting it. For example: “ESZ26, full electronic session, five sessions, tick resolution, one tick per level, 68% value area.” That description makes the profile analysis reproducible instead of subjective.
Practical Futures Volume Profile Example: ES
Consider a hypothetical ES session with the following profile:
- Session high: 6,810.00
- VAH: 6,792.00
- POC: 6,775.25
- VAL: 6,758.50
- Session low: 6,742.00
Suppose price opens the next session above VAH at 6,798.00. A weak interpretation would be: “VAH is support, so buy.” A stronger Futures Volume Profile process asks additional questions. Is price accepting above the prior value area or immediately falling back inside? Is current volume expanding? Is the market above or below overnight inventory? Where is the current session’s developing POC? Is a scheduled macro release about to alter volatility?
If price trades above prior VAH, builds new volume there and develops a higher POC, that provides different context from a brief opening spike followed by acceptance back inside the old value area. The profile should therefore describe market structure, not replace live evidence.
For ES tick value and contract mechanics, use our Futures Contract Specifications 2026 reference before translating a chart level into dollar risk.
Common Futures Volume Profile Shapes
NinjaTrader educational material describes recurring profile shapes such as D, P, b and B. These shapes can help organize observations, but they should not be treated as deterministic patterns.
| Shape | Visual Character | Possible Context | Do Not Assume |
|---|---|---|---|
| D | Balanced, rounded distribution | Two-sided trade / balance | That balance must continue |
| P | Larger upper distribution with thinner lower area | Can appear after upward movement or short covering | Automatic bullish continuation |
| b | Larger lower distribution with thinner upper area | Can appear after downward movement or long liquidation | Automatic bearish continuation |
| B / double distribution | Two larger nodes separated by a thinner zone | Two accepted areas separated by lower participation | Which distribution will win next |
The value of a shape is in forming a testable market hypothesis. The chart still needs price action, volume, liquidity and risk controls. A profile pattern that worked yesterday can fail today.
A Practical Futures Volume Profile Trading Workflow
Use this process to keep Futures Volume Profile analysis disciplined:
- Choose the correct contract month. Volume belongs to a specific futures contract. Confirm that liquidity has not rolled into another expiration.
- Define the session. Decide whether the analysis uses the full electronic session, regular trading hours, or another documented template.
- Set the data resolution. NinjaTrader notes that tick data is more accurate and more resource intensive than minute-based approximation.
- Mark POC, VAH and VAL. Record them before the next session if they are part of the plan.
- Identify HVNs and LVNs. Use them as context for where prior participation concentrated or thinned.
- Watch developing value. A migrating POC or value area can reveal that current activity is concentrating somewhere new.
- Confirm with live conditions. Check price structure, current volume, spread, depth and volatility.
- Define invalidation. Do not enter merely because price touched a profile level.
- Calculate dollar risk. Convert stop distance into ticks and dollars before placing the order.
- Review after the session. Compare the planned interpretation with what the market actually did.
During quarterly index rollovers, also verify the active contract using our Futures Rollover Dates 2026 guide. A beautifully configured profile on a stale expiration can still produce poor execution context.
Using Futures Volume Profile in NinjaTrader
NinjaTrader’s documentation lists Order Flow Volume Profile as both an indicator and a drawing tool. Depending on the current product configuration and access level, traders can build session, bar-based or composite profiles and configure settings such as volume resolution, ticks per level, POC, value area, developing POC and developing value-area lines.
The documentation states that minute resolution can be used for faster approximate profile generation, while tick resolution uses one-tick data and is more accurate but more resource intensive. This is a meaningful technical trade-off. A trader analyzing a narrow intraday range may prefer tick-level precision, while a broad multi-day profile may prioritize load time and usability.
Another important setting is trading hours. A Futures Volume Profile can change if one trader uses regular trading hours and another includes the overnight electronic session. When sharing screenshots or levels, include the session definition so the analysis can be reproduced.
Explore NinjaTrader for futures charting, simulation and Order Flow analysis
Platform features, plan names and pricing can change. Verify current availability directly with NinjaTrader before choosing a plan specifically for Order Flow features.
Common Futures Volume Profile Mistakes
1. Treating POC as Guaranteed Support or Resistance
The POC identifies the strongest concentration in the selected profile. It does not force the next auction to react there.
2. Ignoring the Session Template
Regular-hours and full-session profiles can create different POC, VAH and VAL levels. A screenshot without session context can be misleading.
3. Using the Wrong Contract Month
Near rollover, volume can migrate into the next futures expiration. Always confirm the active contract before building the profile.
4. Mixing Platform Defaults
One platform may use a 68% value area and another may use 70% or allow customization. Levels can differ even when both charts use the same market and period.
5. Overfitting Custom Profiles
Dragging a fixed-range profile until it perfectly explains past price action creates hindsight bias. Define the analytical range before drawing conclusions.
6. Ignoring Live Liquidity
Historical volume-at-price does not show the current bid/ask spread or depth available for your next order. Execution conditions still matter.
Pros and Limitations of Futures Volume Profile
Pros
- Shows where volume occurred by price.
- Identifies POC, value area, HVNs and LVNs.
- Useful for session and composite analysis.
- Complements traditional volume and footprint charts.
- Can make prior balance and low-participation zones easier to visualize.
- Works well as part of a repeatable trading review process.
Limitations
- Levels depend on settings and data source.
- Historical concentration does not guarantee a future reaction.
- Value-area defaults differ across platforms.
- Session definitions can materially change the profile.
- Does not replace live liquidity analysis.
- Can encourage overfitting if custom ranges are chosen retrospectively.
Who Is Futures Volume Profile Best For?
Futures Volume Profile is most useful for traders who already understand basic futures mechanics and want a structured way to analyze volume-at-price. It can be especially useful for index futures, energy, metals and other actively traded contracts where centralized exchange volume provides meaningful transaction data.
It is not ideal as a standalone beginner signal generator. Traders still need to understand tick value, contract months, liquidity, volatility and position sizing. If those basics are missing, a sophisticated profile can create false confidence rather than better decisions.
For platform selection, see our Best Futures Trading Platforms 2026 guide and our NinjaTrader Review 2026.
Futures Volume Profile FAQ
What is Futures Volume Profile?
Futures Volume Profile is a volume-at-price visualization that shows how much trading activity occurred at different prices over a selected range or session.
What is the POC in Volume Profile?
POC means Point of Control. NinjaTrader defines it as the single largest data point in the profile, commonly interpreted as the price level with the highest traded volume in a standard volume profile.
What are VAH and VAL?
VAH is Value Area High and VAL is Value Area Low. They mark the upper and lower boundaries of the selected value area around the profile’s highest-volume region.
Is the value area always 70%?
No. Platform settings differ. NinjaTrader documents a configurable value area with a 68% default, while other software may use 70% or another user-defined percentage. Always verify the setting before comparing levels.
What is the difference between HVN and LVN?
An HVN is a relatively thick high-volume region, while an LVN is a relatively thin low-volume region. They describe prior participation, not guaranteed future support or resistance.
Is Volume Profile the same as Market Profile?
No. The concepts are related but not identical. Volume Profile distributes traded volume by price, while price/time-profile methods can represent time or occurrences at price rather than actual contract volume.
Does Futures Volume Profile predict price direction?
No. It describes where prior activity occurred. Direction still depends on new order flow, information, liquidity, volatility and broader market structure.
Should I use RTH or ETH for Volume Profile?
There is no universal answer. Use the session definition that matches your strategy and document it consistently. The important point is that RTH and full electronic-session profiles can produce different levels.
Final Verdict: How to Use Futures Volume Profile Correctly
Futures Volume Profile is valuable because it reorganizes exchange activity around price instead of time. POC, VAH, VAL, HVNs and LVNs can provide a clear framework for understanding where the market previously concentrated business and where participation was relatively thin.
The strongest use is contextual. Define the contract, session, profile period, resolution and value-area setting first. Then combine the profile with current price behavior, volume, liquidity and disciplined risk management. Do not assume a level must hold simply because it appears important on a historical profile.
Used this way, Volume Profile becomes a reproducible market-structure tool rather than another collection of colored lines.
Explore NinjaTrader for futures charting, simulation and Order Flow tools
Affiliate Disclosure: TradeboticsAI may receive compensation when eligible users complete a qualifying action through certain affiliate links. Affiliate relationships do not determine our editorial conclusions.
Risk Disclosure: Futures trading involves substantial risk of loss and is not suitable for every investor. Volume Profile, POC, value-area levels and historical volume relationships do not predict future price movement. Simulated and backtested results are hypothetical and do not guarantee future performance. Nothing on this page is personalized investment, financial, tax or trading advice.