Futures Time and Sales 2026: Tape Reading, Speed & Order Flow Guide
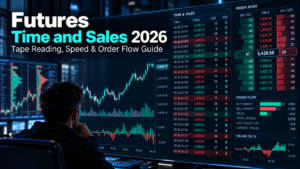
Futures time and sales shows executed futures transactions as they occur. Instead of compressing market activity into a candle, the tape lets traders observe transaction time, price, size and the sequence in which trading activity reaches the market.
For active futures traders, futures time and sales can help answer a more useful question than simply whether buyers or sellers are active: is aggressive participation actually producing price progress?
A large transaction, rapid burst of prints or repeated buying at the ask does not automatically predict direction. Tape reading becomes more useful when transaction activity is evaluated together with price location, DOM liquidity, footprint data, Volume Delta and the market’s actual response.
Futures time and sales is a chronological transaction feed showing completed futures trades. Traders commonly study price, size, bid/ask aggression, transaction pace, repetition and resulting price movement.
A practical framework is:
location → aggression → size → speed → repetition → price response → confirmation → risk.
NinjaTrader provides Time & Sales alongside charts, DOM and futures-analysis tools. Use simulation to learn how transaction flow behaves before exposing real capital.
Affiliate Disclosure: TradeboticsAI may receive compensation when an eligible user completes a qualifying action through a marked affiliate link, at no additional cost to the user. Affiliate relationships do not determine our editorial conclusions.
What Is Futures Time and Sales?
Futures time and sales is the chronological record of executed transactions for a futures contract. Rather than displaying only summarized candles or resting market depth, it exposes the sequence of trades that have actually occurred.
The information normally available in a futures time and sales window includes:
- transaction time;
- executed price;
- trade size or volume;
- bid and ask context;
- last-traded information;
- optional large-trade or block highlighting;
- optional filtering and aggregation.
A tape reader may use that information to study whether buyers are repeatedly lifting offers, whether sellers are repeatedly hitting bids, whether transaction speed is accelerating and whether unusually large prints are producing meaningful movement.
The core distinction is simple: completed transactions show what actually traded. Resting liquidity shows what is currently displayed as available to trade.
How to Read a Futures Time and Sales Tape
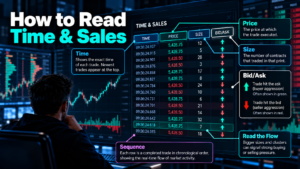
A useful futures time and sales process begins by understanding the fields displayed on the tape rather than simply following colors.
| Field | What It Shows | Question to Ask |
|---|---|---|
| Time | When the transaction occurred | Is transaction activity accelerating or slowing? |
| Price | The price at which execution occurred | Is trading progressing into new prices? |
| Size | Number of contracts represented by the print | Is trade size unusual relative to surrounding activity? |
| Bid | Current or contextual bid information | Are sellers aggressively trading against bids? |
| Ask | Current or contextual ask information | Are buyers aggressively trading against offers? |
| Block / Filter | Highlights transactions meeting a selected size threshold | Does unusually large activity create continuation or absorption? |
The sequence matters more than an isolated line. A single 50-contract transaction may have limited value. A sustained sequence of aggressive transactions occurring at the same level while price refuses to advance can provide substantially more context.
Bid vs Ask Aggression in Futures Time and Sales
Futures time and sales can help traders observe the relationship between aggressive execution and market response.
Aggressive Buying
A buyer seeking immediate execution generally accepts available ask liquidity. Repeated executions associated with the ask can therefore indicate aggressive buying pressure.
Aggressive Selling
A seller seeking immediate execution generally accepts available bid liquidity. Repeated executions associated with the bid can indicate aggressive selling pressure.
But aggression is not the same thing as control.
| Transaction Activity | Price Response | Possible Interpretation |
|---|---|---|
| Repeated ask-side buying | Price advances rapidly | Buying aggression is producing upward progress |
| Repeated ask-side buying | Price barely advances | Possible passive selling or absorption |
| Repeated bid-side selling | Price declines rapidly | Selling aggression is producing downward progress |
| Repeated bid-side selling | Price refuses to decline | Possible passive buying or absorption |
This effort-versus-result relationship is one of the most valuable ways to interpret futures time and sales.
Futures Time and Sales Speed: Why Transaction Pace Matters
Speed of tape describes how rapidly executions are appearing. A market can transition from relatively slow transactions to an extremely fast sequence within seconds.
Acceleration may occur during:
- breakout attempts;
- economic releases;
- liquidation events;
- stop triggering;
- opening volatility;
- important support or resistance tests;
- rapid repricing.
The useful question in futures time and sales is not merely whether the tape became fast. It is whether increased transaction intensity produces corresponding price movement.
A practical observation sequence is:
slow → accelerating → high activity → measurable price progress?
If the tape accelerates dramatically but price does not advance, aggressive participants may be meeting substantial opposing liquidity.
If acceleration is accompanied by rapid movement through multiple prices and those prices subsequently hold, the same speed can reflect successful directional aggression.

Trade Size and Large Prints
In futures time and sales, large transactions attract attention because they represent more executed contracts than surrounding prints.
But there is no universal number that defines a meaningful large trade across every futures contract.
A trader should instead ask:
- Is the transaction large relative to recent prints?
- Is the transaction unusual for this contract?
- Is the transaction unusual for this time of day?
- Are multiple large transactions appearing together?
- Are they executing near the bid or ask?
- Is price moving after the transactions?
- Is price repeatedly refusing to move despite large execution?
Instrument context matters. ES, MES, NQ, MNQ, CL and GC have different liquidity profiles and transaction-size distributions.
Futures Time and Sales: Price Response Matters More Than the Largest Print
One of the strongest improvements a trader can make is to stop asking only whether a transaction was large and start asking what price did after the transaction occurred.
Assume NQ reaches resistance. Buyers aggressively lift the ask and several relatively large transactions execute. Yet price advances only one tick before returning below resistance.
The important information is:
high buying effort + weak upward result.
Now compare that with another situation where moderate buying rapidly moves NQ through several price levels and the market remains above the breakout.
The second example shows stronger price efficiency despite potentially smaller individual prints.
Futures time and sales therefore becomes more valuable when the trader continuously compares executed aggression with resulting movement.
Six Practical Futures Time and Sales Tape-Reading Patterns
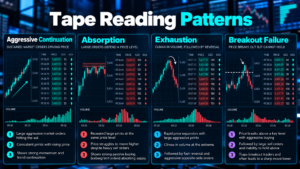
1. Aggressive Continuation
Transaction flow accelerates in one direction, price moves through nearby levels and subsequent pullbacks fail to reverse the progress.
2. Absorption
Large or repeated aggressive executions occur but price struggles to move through the opposing level.
3. Exhaustion
A previous burst of transaction activity loses speed and price stops extending despite continued attempts.
4. Breakout Acceptance
Price crosses an important level, executions continue beyond it and the market begins doing meaningful business on the new side.
5. Breakout Failure
A transaction burst pushes through a level but price quickly returns into the prior range.
6. Liquidity Vacuum
Price travels rapidly through several levels with relatively little opposing resistance. A dramatic move does not always require one enormous individual transaction.
Futures Time and Sales vs DOM
Futures time and sales and the Depth of Market answer related but different questions.
| Tool | What It Shows | Primary Strength | Main Limitation |
|---|---|---|---|
| Time & Sales | Executed transactions | Shows what actually traded | Does not display the full resting order book |
| DOM | Displayed liquidity at bid and ask prices | Shows where visible orders are resting | Resting orders can be changed or canceled |
A trader can use the DOM to identify displayed liquidity and then use futures time and sales to observe whether actual transactions consume, fail against or move through that liquidity.
See our Best DOM Trading Platforms 2026 guide for a broader comparison of depth-of-market tools.
Futures Time and Sales vs Footprint Charts
A footprint chart reorganizes transaction information by price and bar. Futures time and sales preserves the live chronological transaction stream.
| Tool | Primary View | Strength |
|---|---|---|
| Time & Sales | Chronological transaction sequence | Speed, repetition and live flow |
| Footprint | Bid/ask activity organized by bar and price | Historical structure and price-level comparison |
A trader can use a footprint to identify a possible imbalance or absorption area and then monitor futures time and sales when price revisits that level.
See our Best Footprint Chart Platforms 2026 comparison.
Futures Time and Sales vs Volume Delta
Volume Delta compresses aggressive buying and selling into a numerical difference. Futures time and sales preserves the sequence in which individual transactions arrive.
This creates a useful distinction:
Delta summarizes aggression. Time & Sales exposes sequence.
For example, positive delta may indicate greater classified aggressive buying than selling. The tape can show whether that buying arrived gradually, during one burst, through repeated larger transactions or near a critical price.
Related guides:
Using Futures Time and Sales in NinjaTrader
NinjaTrader Desktop includes a dedicated Time & Sales window for monitoring transaction activity.
The configurable futures time and sales display can help reduce visual noise while preserving transaction information required for structured tape analysis.
Depending on the current platform configuration, traders can work with information and settings including:
- Bid, Ask and Last information;
- transaction time;
- transaction price;
- transaction size;
- large-trade or block thresholds;
- formatting and colors;
- transaction aggregation;
- displayed columns.
For current platform behavior and configuration options, see the
official NinjaTrader Time & Sales documentation.
Aggregation settings can materially change how the tape appears. If a trader aggregates transactions instead of viewing every individual print, the visual sequence becomes different.
For repeatable futures time and sales research, record the settings used when comparing screenshots, replay sessions or trading-journal observations.
Use NinjaTrader’s transaction tape together with charts, DOM and order-flow context before deciding whether tape reading improves your trading process.
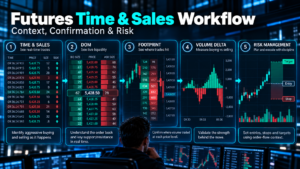
A Repeatable Futures Time and Sales Workflow
A disciplined futures time and sales workflow should begin with market context rather than random tape watching.
- Choose one liquid contract.
Learn the normal transaction rhythm of one market before switching constantly between instruments. - Know tick size and tick value.
Tape movement has little meaning without understanding the economics of each price increment. - Mark important locations first.
Examples include PDH, PDL, prior close, VWAP, Volume Profile levels and opening-range boundaries. - Observe baseline tape speed.
You need a reference for normal activity before acceleration becomes meaningful. - Watch bid/ask aggression.
Determine whether buyers or sellers appear to be crossing the spread aggressively. - Compare size with recent size.
Avoid applying one fixed large-trade threshold to every instrument. - Measure price progress.
Ask how much movement is being produced by the observed aggression. - Look for repetition.
Sequences usually carry more information than one isolated print. - Confirm with broader structure.
Use tape to test an existing setup rather than to invent trades continuously. - Define invalidation.
Know what market behavior would make the thesis wrong. - Record the outcome.
Save screenshots, transaction context and resulting price behavior.
For deliberate practice, combine futures time and sales observation with NinjaTrader Market Replay.
Common Futures Time and Sales Mistakes
1. Reading Colors Instead of Transactions
Colors are presentation tools. Understand what the platform is classifying rather than assuming one color automatically predicts direction.
2. Trading Every Large Print
Large transactions can occur during continuation, absorption, liquidation or normal market activity.
3. Ignoring Price Response
Aggressive trading that fails to create movement can be fundamentally different from aggression that rapidly moves the market.
4. Watching the Tape Without Market Location
Futures time and sales becomes easier to interpret around objectively important prices than in the middle of random intraday movement.
5. Using One Large-Trade Threshold Everywhere
Transaction distributions vary across futures contracts and trading sessions.
6. Confusing Resting Liquidity With Executed Volume
The DOM displays resting orders. Time & Sales records completed transactions.
7. Assuming the Tape Reveals Participant Identity
Executed transaction size does not disclose a trader’s full strategy or inventory.
8. Overtrading When Tape Speed Increases
Fast tape is information. It is not automatically an entry signal.
Futures Time and Sales Pros and Cons
Pros
- Shows completed transactions.
- Preserves transaction sequence.
- Helps evaluate transaction speed.
- Can highlight relative changes in trade size.
- Useful around breakouts and absorption areas.
- Combines naturally with DOM and footprint analysis.
- Provides a direct view of actual executions.
Cons
- Fast markets can be visually overwhelming.
- Individual prints are easy to overinterpret.
- Large-trade thresholds vary by instrument.
- Classification depends on data and platform methodology.
- The tape does not reveal complete participant intent.
- It does not predict future prices.
- Structured practice is required.
Who Is Futures Time and Sales Best For?
Best For
- active futures traders;
- ES, NQ, MES and MNQ traders;
- short-term scalpers;
- DOM traders;
- footprint-chart users;
- order-flow traders;
- traders analyzing breakout acceptance or failure;
- users willing to study one market consistently.
Not Ideal For
- long-term investors;
- traders seeking automatic buy/sell signals;
- beginners who have not learned tick value and basic order mechanics;
- users who cannot process rapid transaction streams;
- traders expecting one large print to predict direction.
For related execution research, see our Best Futures Brokers for Scalping 2026 guide.
Futures Time and Sales Costs, Data Requirements and Limitations
Futures time and sales depends on market data. Real-time futures data may involve exchange subscription charges depending on the broker, exchange, data package and professional or non-professional status.
Possible costs can include:
- platform fees;
- exchange market-data fees;
- broker commissions;
- exchange transaction fees;
- regulatory charges;
- clearing costs;
- spread and slippage;
- optional advanced order-flow tools.
Current fees should always be verified directly with the relevant broker, platform and exchange before funding or trading an account.
No futures time and sales setup removes execution risk. A trader can correctly identify transaction aggression and still lose money because of poor position sizing, slippage, invalidation, market regime or entry timing.
Futures Time and Sales FAQ
What is futures time and sales?
Futures time and sales is a chronological record of executed futures transactions showing data such as transaction time, execution price and trade size.
Is Futures Time and Sales the same as the DOM?
No. Time & Sales focuses on executed transactions, while DOM primarily displays visible resting bid and ask liquidity at different prices.
What does a trade at the ask mean?
Under common classification logic, it can indicate a buyer accepting available ask liquidity for immediate execution. It does not guarantee that price will continue higher.
What does a trade at the bid mean?
It can indicate a seller accepting available bid liquidity. It does not guarantee continued downside.
What is speed of tape?
Speed of tape describes the rate at which transactions are occurring. Acceleration can indicate increased urgency or participation but does not determine direction on its own.
What is a large print?
A large print is a transaction considered unusually large relative to a selected threshold or recent market activity. The appropriate threshold varies by futures contract.
Can Futures Time and Sales show absorption?
Futures time and sales can provide evidence consistent with absorption when repeated aggressive transactions occur but price fails to progress through an opposing level. Footprint and DOM context can provide additional evidence.
Can Time and Sales predict reversals?
No. It provides transaction-flow evidence. Reversals remain probabilistic and require market structure, confirmation and risk management.
Is Futures Time and Sales useful for scalping?
It can be useful for traders who need short-term information about transaction pace, aggression and response. It also increases cognitive load and requires practice.
Does NinjaTrader have Time and Sales?
Yes. NinjaTrader Desktop documents a dedicated Time & Sales window for monitoring transaction information and related display settings.
Should I combine Futures Time and Sales with a footprint chart?
They can complement each other. Footprints organize transaction activity by price and bar, while futures time and sales preserves the chronological sequence.
Should I combine Time and Sales with Volume Delta?
Yes, when both tools have defined roles. Delta summarizes classified aggression, while the tape exposes how individual transactions arrive.
Does faster tape mean price will continue?
No. Fast transaction flow can accompany continuation, liquidation, exhaustion, news reactions or absorption.
Final Verdict: How to Use Futures Time and Sales Correctly
Futures time and sales is most useful when treated as a transaction microscope rather than a market-prediction system.
The tape helps answer three important questions:
- Which side is acting aggressively?
- How much transaction activity is occurring and how quickly?
- Is that activity actually moving price?
The stronger process is:
location → aggression → size → speed → repetition → price response → confirmation → risk.
Do not buy because transaction colors appear bullish. Do not short simply because selling accelerates. Do not assume a large print predicts the next move.
Instead, identify an important level first. Then use futures time and sales to evaluate whether aggressive participants successfully move the auction or repeatedly fail against opposing liquidity.
Used this way, tape reading can add useful detail to DOM, footprint charts, Volume Delta, Cumulative Delta and broader futures order-flow analysis.
Evaluate Futures Time & Sales in Simulation
Build a repeatable tape-reading process before introducing live financial risk.
Related TradeboticsAI Guides
Risk, Simulation & Affiliate Disclosure
Risk Disclosure: Futures trading involves substantial risk of loss and is not suitable for every investor. Leverage can magnify losses rapidly. Futures Time & Sales, DOM, footprint charts, Volume Delta, Cumulative Delta and other order-flow tools do not predict future prices or guarantee profitable results.
Simulation Disclosure: Simulated, replayed, backtested and paper-trading results are hypothetical. Live trading can differ materially because of liquidity, queue position, slippage, latency, commissions, partial fills, rejected orders, connectivity and the psychological effects of risking real capital.
Affiliate Disclosure: TradeboticsAI may receive compensation from qualifying actions completed through certain affiliate links. Compensation does not determine our editorial conclusions and does not replace independent verification of platform features, data access, fees and account requirements.
Educational Use: Nothing on this page constitutes individualized financial, investment, legal or tax advice.