Futures Volume Delta 2026: Bid/Ask Delta, Bar Delta & Divergence Guide
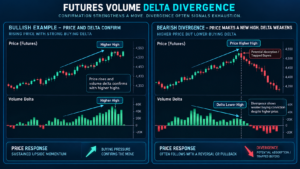
Futures Volume Delta measures the difference between aggressive buying volume and aggressive selling volume in exchange-traded futures. On a bid/ask footprint, trades executed at the ask are generally classified as aggressive buying, while trades executed at the bid are classified as aggressive selling. Delta converts that transaction flow into a simple number: buying volume minus selling volume. But positive delta does not automatically mean price must rise, and negative delta does not guarantee lower prices. The real information comes from comparing aggressive participation with price progress, market location, absorption and the subsequent auction response.
Quick Answer
Futures Volume Delta is commonly calculated as ask volume minus bid volume. Positive delta indicates that more volume traded aggressively at the ask; negative delta indicates more aggressive selling at the bid. Delta can be measured at one price, across an entire footprint bar, as a percentage of total volume or cumulatively across a session. The strongest analysis asks whether price actually responds to the aggressive side. Large positive delta with no upward progress can signal absorption or trapped buyers, while strong negative delta with no downside progress can reveal passive buying.
Explore NinjaTrader for Volumetric Bars, delta analysis and futures simulation
Affiliate Disclosure: TradeboticsAI may earn compensation when an eligible user completes a qualifying action through an affiliate link, at no additional cost to the user. Affiliate relationships do not determine our editorial conclusions.
What Is Futures Volume Delta?
Futures Volume Delta measures the imbalance between transactions classified as aggressive buying and aggressive selling. On a BidAsk-style footprint, buyers are considered aggressive when they cross the spread and execute against resting offers. Sellers are considered aggressive when they sell into resting bids.
NinjaTrader describes its Volumetric Bars as an “x-ray” view of aggressive buying and selling inside each price bar. The platform exposes bid volume, ask volume, total buying volume, total selling volume, price-level delta, total bar delta, maximum positive and negative delta, and cumulative delta.
That makes delta different from conventional volume. Total volume tells you how much trading occurred. Delta tries to describe which side demanded immediate execution more aggressively.
If 8,000 contracts trade during an ES bar, total volume alone cannot tell whether aggressive buyers or sellers dominated those transactions. If 5,200 contracts traded at the ask and 2,800 at the bid, the same bar has a positive delta of 2,400 contracts.
The central mistake is assuming that aggressive participation automatically equals market control. Futures Volume Delta measures effort. Price shows whether that effort succeeded.
Official reference:
NinjaTrader Order Flow Volumetric Bars documentation.
Futures Volume Delta Formula
The common BidAsk calculation is straightforward:
Volume Delta = Ask Volume − Bid Volume
For example:
- Ask volume: 5,200 contracts
- Bid volume: 2,800 contracts
- Delta: +2,400 contracts
A positive reading means more volume was classified as aggressive buying. A negative reading means aggressive selling exceeded aggressive buying.
Another bar might contain:
- Ask volume: 3,100
- Bid volume: 5,900
- Delta: −2,800
The second bar contains stronger aggressive selling, but this does not tell us whether price actually moved lower. If price remained stable despite −2,800 delta, passive buyers may have successfully absorbed the selling.
That effort-versus-result relationship is the foundation of useful Futures Volume Delta analysis.
Cell Delta vs Bar Delta vs Cumulative Delta
The word “delta” is used for several related measurements. Keeping them separate prevents unnecessary confusion.
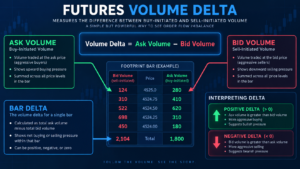
| Metric | Scope | Calculation | Best Use |
|---|---|---|---|
| Price-Level Delta | One footprint price | Ask − Bid at that price | Localized aggression |
| Bar Delta | Entire bar | Total buy volume − total sell volume | Net bar aggression |
| Delta % | Entire bar | Delta relative to total volume | Normalize bars with different volume |
| Cumulative Delta | Multiple bars/session | Running sum of bar delta | Broader aggressive-flow context |
NinjaTrader’s Volumetric Bars documentation separately exposes price-level delta, total bar delta, maximum positive and negative delta, delta percentage and cumulative delta. That distinction is important because each measurement operates at a different scale.
This page focuses primarily on Futures Volume Delta at the price and bar level. For session-level accumulation and anchored divergence, use the dedicated Futures Cumulative Delta 2026 guide.
BidAsk vs UpDownTick Futures Volume Delta
Not every data setup classifies buying and selling in exactly the same way. NinjaTrader supports two primary delta classification modes for Volumetric Bars: BidAsk and UpDownTick.
BidAsk
BidAsk classification uses quoted bid and ask information. Transactions executed at the ask or higher are classified as buying pressure; transactions executed at the bid or lower are classified as selling pressure.
This method most directly represents the standard definition used throughout this Futures Volume Delta guide.
UpDownTick
UpDownTick classification uses changes in trade price. An uptick is treated as buying pressure and a downtick as selling pressure. This can be useful when historical bid/ask tick information is unavailable.
The two methods are not interchangeable. A trader testing a delta strategy should record the classification method rather than comparing historical results produced by one method with live signals produced by another.
NinjaTrader also notes that historical BidAsk classification requires appropriate historical bid/ask tick data from the data provider.
For Futures Volume Delta, data methodology is part of the strategy definition—not a technical detail to ignore.
Futures Volume Delta Percentage
Raw delta is useful, but it does not account for differences in total bar volume. A +2,000 delta means something different in a 3,000-contract bar than in a 40,000-contract bar.
A normalized approach is:
Delta % = Delta ÷ Total Volume × 100
Suppose Bar A records:
- Total volume: 5,000
- Delta: +2,000
- Delta percentage: +40%
Bar B records:
- Total volume: 25,000
- Delta: +2,000
- Delta percentage: +8%
The absolute delta is identical, but the aggressive imbalance relative to all transactions is much stronger in Bar A.
NinjaTrader exposes a GetDeltaPercent value for Volumetric Bars, allowing bar-level Futures Volume Delta to be evaluated relative to total activity.
There is no universal delta-percentage threshold that predicts continuation or reversal. Appropriate values depend on instrument, session, volatility and bar construction.
How to Read Futures Volume Delta With Price
The most useful way to read Futures Volume Delta is not positive versus negative. It is delta versus price response.
| Delta | Price Response | Possible Interpretation |
|---|---|---|
| Strong Positive | Price advances and holds | Aggressive buying is producing progress |
| Strong Positive | Price stalls or falls | Possible absorption or trapped buyers |
| Strong Negative | Price declines and holds lower | Aggressive selling is producing progress |
| Strong Negative | Price refuses to fall | Possible passive buying / absorption |
This framework explains why a highly positive reading near a session high can be bearish in context. The number itself is not bearish. The failure of aggressive buyers to obtain higher prices is the relevant information.
Likewise, negative delta at a low is not automatically bullish. If price continues falling efficiently, sellers remain in control.
Futures Volume Delta therefore works best as an efficiency measurement: how much price progress did the aggressive side obtain for the transaction volume it committed?
Futures Volume Delta Divergence
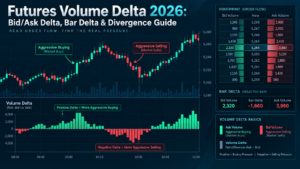
A delta divergence occurs when price and aggressive transaction flow stop confirming each other.
Potential Bearish Divergence
Price reaches a new swing high, but the newest bars show less positive Futures Volume Delta than earlier pushes. This can indicate that aggressive buyers are participating less strongly even though price is still advancing.
Potential Bullish Divergence
Price reaches a new swing low, but negative delta becomes progressively weaker. Sellers are still moving price lower, but aggressive participation is declining.
Neither setup guarantees reversal. Price can advance while delta declines because offers are becoming thinner. Price can fall with less negative delta because bids have disappeared.
Divergence becomes more useful when it occurs at a meaningful reference such as a prior high/low, Value Area edge, VWAP band or failed breakout and is followed by rejection.
For multi-bar or session-level divergence, Cumulative Delta is usually more practical than isolated bar values. See Futures Cumulative Delta 2026.
Futures Volume Delta and Absorption
Absorption is one of the most important applications of Futures Volume Delta.
Suppose ES reaches prior-day low and one footprint bar records:
- Buy volume: 3,400
- Sell volume: 9,100
- Delta: −5,700
That is heavy aggressive selling. If ES then continues lower rapidly, sellers succeeded.
But suppose 9,100 sell contracts execute and ES cannot trade sustainably below the low. The large negative delta tells us aggressive sellers attacked. The failure to continue tells us their selling was accepted by enough passive buying to prevent further progress.
The delta itself did not predict the reversal. The combination of extreme aggression and poor price progress revealed absorption.
This is why the TradeboticsAI process uses:
Delta → price progress → persistence → response.
See Futures Absorption Trading 2026 for the complete framework.
Futures Volume Delta and Exhaustion
Exhaustion is different. Instead of extreme aggressive volume being stopped, the aggressive side begins producing less volume as the move reaches new prices.
For example, four successive upside ES impulses might print bar delta of:
- +2,100
- +1,480
- +760
- +190
If price keeps making marginal new highs while aggressive buying progressively declines, buying participation may be exhausting.
Again, the final +190 Futures Volume Delta reading does not create a short signal. Price needs to fail, return beneath the extreme or attract meaningful aggressive selling.
See Futures Exhaustion Trading 2026 for the full distinction between exhaustion and absorption.
Futures Volume Delta vs Footprint Imbalance
Delta and imbalance use similar data but measure it differently.
Futures Volume Delta typically summarizes ask volume minus bid volume at one price or across an entire bar.
A footprint imbalance compares buy and sell volume between specific price levels, often diagonally. Several consecutive imbalances can create a stacked imbalance zone.
| Tool | Question |
|---|---|
| Price-Level Delta | What is the net buy/sell aggression at this exact price? |
| Bar Delta | Who was more aggressive across the entire bar? |
| Footprint Imbalance | Is one aggressor materially stronger across the spread at a price comparison? |
| Stacked Imbalance | Does that aggressive asymmetry repeat across neighboring prices? |
For repeated diagonal imbalance analysis, see Futures Stacked Imbalance 2026.
TradeboticsAI Futures Volume Delta Framework
TradeboticsAI uses five layers to evaluate Futures Volume Delta rather than treating the sign of the number as a buy or sell signal.
| Layer | Question | Higher-Quality Evidence |
|---|---|---|
| 1. Location | Where is the delta occurring? | Prior high/low, VWAP, profile edge, breakout area |
| 2. Magnitude | Is the reading unusual for this market? | Meaningful relative to surrounding bars/session |
| 3. Price Progress | Did aggression move price? | Clear continuation or clear failure |
| 4. Persistence | Does the behavior repeat? | Multiple bars/levels confirm the same process |
| 5. Resolution | How does the market resolve the conflict? | Acceptance, rejection, breakout or reclaim |
This creates four basic outcomes:
- Positive delta + higher acceptance: buyers are aggressive and effective.
- Positive delta + failed progress: investigate absorption or trapped longs.
- Negative delta + lower acceptance: sellers are aggressive and effective.
- Negative delta + failed progress: investigate absorption or trapped shorts.
The framework turns Futures Volume Delta into a market-efficiency measurement rather than a colored histogram.
Explore NinjaTrader Order Flow+ for Volumetric Bars and delta analysis
Practical Futures Volume Delta Example: ES Failed High
Assume ES prior-day high is 6,520.00. Price rallies into the level during the U.S. session and breaks to 6,522.00.
The breakout bar records:
- Total volume: 12,000 contracts
- Ask volume: 8,250
- Bid volume: 3,750
- Bar delta: +4,500
- Delta percentage: +37.5%
The numbers show substantial aggressive buying. But the market cannot sustain trade above 6,522.00.
Another 3,000 contracts trade aggressively at the ask near the high, yet ES does not extend. The next bar falls below 6,520.00 and begins printing negative delta.
The correct interpretation is not that positive Futures Volume Delta was bearish. Positive delta accurately reported aggressive buying.
The important information is that aggressive buying failed.
The sequence becomes:
major location → strong positive delta → limited progress → failed acceptance → reclaim below breakout → sellers respond.
That can support a trapped-buyers or absorption hypothesis. See Futures Trapped Traders 2026 for the failed-breakout framework.
If ES instead held above 6,520.00, built volume near 6,523.00 and continued higher, the same +4,500 delta would support successful breakout participation.
A Practical Futures Volume Delta Trading Workflow
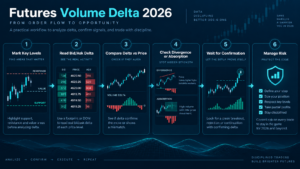
- Use the active contract. During rollover, analyze the expiration carrying relevant volume.
- Standardize the data method. Document BidAsk or UpDownTick classification.
- Define location first. Mark prior highs/lows, VWAP, Volume Profile and auction boundaries.
- Establish normal delta. Compare current readings with the same instrument and session rather than arbitrary universal values.
- Measure aggressive participation. Note price-level delta, bar delta and delta percentage where useful.
- Compare delta with price progress. Determine whether the aggressive side is obtaining movement.
- Look for persistence. One extreme reading is weaker than a meaningful sequence.
- Identify absorption or exhaustion. Heavy failed aggression and fading aggression represent different conditions.
- Wait for auction resolution. Acceptance, rejection or reclaim should confirm the interpretation.
- Define invalidation and risk. Delta analysis never removes the need for position sizing and a maximum acceptable loss.
This approach keeps Futures Volume Delta anchored to actual transaction behavior instead of transforming it into an automatic oscillator.
Common Futures Volume Delta Mistakes
1. Assuming Positive Delta Is Always Bullish
Positive delta means aggressive buyers traded more volume. They can still be absorbed or trapped.
2. Assuming Negative Delta Is Always Bearish
Heavy aggressive selling can fail completely when passive buyers absorb the flow.
3. Ignoring Total Volume
A +500 delta in a 900-contract bar is different from +500 in a 20,000-contract bar. Delta percentage can add context.
4. Confusing Bar Delta With Cumulative Delta
Bar delta describes one bar. CVD accumulates delta across many bars from an anchor or session reset.
5. Ignoring Classification Method
BidAsk and UpDownTick are different approaches. Backtests and live analysis should use a consistent methodology where possible.
6. Trading Every Divergence
Price can continue moving while Futures Volume Delta diverges because available liquidity is changing.
7. Ignoring Location
An extreme reading at a meaningful auction boundary is generally more informative than the same number in random mid-range trade.
8. Ignoring Price Response
Delta reports aggression. The market’s response determines whether the aggression actually mattered.
Pros and Limitations of Futures Volume Delta
Pros
- Measures actual aggressive transaction imbalance.
- Adds information hidden by ordinary OHLC candles.
- Works at price, bar and cumulative levels.
- Useful for absorption and exhaustion analysis.
- Can expose failed aggressive breakouts.
- Combines naturally with footprints and Auction Market Theory.
Limitations
- Positive or negative delta alone does not predict direction.
- Results depend on data and classification methodology.
- Strong aggression can be absorbed.
- Divergences can persist for long periods.
- Absolute thresholds vary between contracts and sessions.
- Historical BidAsk analysis requires suitable tick data.
Best For
Futures Volume Delta is most useful for intraday futures traders using footprints, order flow, failed-breakout analysis, absorption or execution-focused market structure.
Not Ideal For
It is less useful for traders looking for a mechanical green-is-buy and red-is-sell indicator or strategies that do not benefit from transaction-level information.
Futures Volume Delta FAQ
What is Futures Volume Delta?
Futures Volume Delta measures the difference between aggressive buy volume and aggressive sell volume, commonly calculated as ask volume minus bid volume.
What does positive volume delta mean?
Positive delta means more volume was classified as aggressive buying than aggressive selling. It does not guarantee that price will rise.
What does negative volume delta mean?
Negative delta means aggressive selling volume exceeded aggressive buying volume. Sellers can still be absorbed and price can rise afterward.
What is bar delta?
Bar delta is total aggressive buying volume minus total aggressive selling volume for one chart bar.
What is price-level delta?
Price-level delta measures the difference between buying and selling volume at an individual footprint price.
What is delta percentage?
Delta percentage expresses bar delta relative to total bar volume. It helps compare aggressive imbalance across bars with different activity levels.
What is the difference between Volume Delta and Cumulative Delta?
Futures Volume Delta can describe one price or bar. Cumulative Delta adds successive bar deltas together to show net aggressive pressure across a longer period.
What is BidAsk delta?
BidAsk delta classifies transactions at the ask as aggressive buying and transactions at the bid as aggressive selling before calculating their difference.
What is UpDownTick delta?
UpDownTick classification uses changes in transaction price rather than historical bid/ask quotes, treating upticks as buying pressure and downticks as selling pressure.
Can volume delta identify absorption?
It can help. Extreme delta combined with very little price progress can indicate that passive liquidity is absorbing aggressive transactions.
Can volume delta identify exhaustion?
Declining delta across successive price extensions can indicate fading aggressive participation, but a reversal still requires confirmation.
Does NinjaTrader support Futures Volume Delta?
Yes. NinjaTrader’s Volumetric Bars expose price-level bid/ask volume, delta, total buying and selling volume, bar delta, delta percentage, maximum delta statistics and cumulative delta. Current access and platform packaging should be verified directly with NinjaTrader.
Can Futures Volume Delta predict price?
No. Futures Volume Delta describes completed aggressive transactions. Future liquidity, cancellations, passive orders and new market participants can change the outcome immediately.
Final Verdict: How to Use Futures Volume Delta Correctly
Futures Volume Delta is valuable because it reveals something ordinary candlesticks cannot: the balance of aggressive transactions occurring inside the futures auction.
But the sign of delta is only the beginning.
The stronger question is:
What did aggressive traders achieve with their volume?
Positive delta accompanied by higher prices and acceptance suggests buyers are effective. Positive delta that cannot move price higher can indicate absorption or trapped buyers. Negative delta accompanied by lower acceptance confirms effective selling. Negative delta that fails to push price lower can reveal passive buying.
Price-level delta provides local detail. Bar delta summarizes the entire candle. Delta percentage normalizes the imbalance relative to volume. Cumulative Delta extends the analysis across the session.
Use Futures Volume Delta alongside Futures Footprint Charts, Order Flow Trading, Cumulative Delta, Absorption, Exhaustion and Stacked Imbalance.
The objective is not to trade a positive or negative number. It is to measure aggressive effort, compare that effort with price response and determine whether the auction rewarded or rejected it.
Explore NinjaTrader for Volumetric Bars, delta analysis and futures simulation
Affiliate Disclosure: TradeboticsAI may receive compensation when eligible users complete a qualifying action through certain affiliate links. Affiliate relationships do not determine our editorial conclusions.
Risk Disclosure: Futures trading involves substantial risk of loss and is not suitable for every investor. Volume delta, footprint charts, Cumulative Delta, divergence, absorption, exhaustion and historical order-flow patterns do not predict future returns. Aggressive transactions can be absorbed, market liquidity can change rapidly, and simulated results do not guarantee future live performance. Nothing on this page is personalized investment, financial, tax or trading advice.