Futures Stacked Imbalance 2026: Footprint Ratios, Bid/Ask & Order Flow Guide
Futures Stacked Imbalance analysis focuses on clusters of consecutive footprint-chart price levels where aggressive buying or selling is materially stronger than the opposing side. Unlike order-book imbalance, which measures resting bids and offers, footprint imbalance is built from executed transactions. A single lopsided row can be noise; multiple same-direction imbalances across adjacent price levels can show that aggressive participants repeatedly crossed the spread through a zone. The strongest use is not to buy every green stack or sell every red stack, but to combine the pattern with market location, price progress, absorption, delta, auction acceptance and predefined risk.
Quick Answer
Futures Stacked Imbalance occurs when several nearby footprint rows show the same directional bid/ask imbalance, indicating repeated aggressive buying or selling across multiple prices. A common footprint method compares ask volume at one price with bid volume one tick lower for buying imbalance, and bid volume with ask volume one tick higher for selling imbalance. NinjaTrader notes that many traders start around a 3:1 ratio, but the threshold is configurable and is not a universal trading rule. A stack becomes more useful when it occurs at an important level and price confirms the aggressive flow rather than immediately absorbing or reversing it.
Explore NinjaTrader for Volumetric Bars, Cumulative Delta and simulated futures order-flow analysis
Affiliate Disclosure: TradeboticsAI may earn compensation when an eligible user completes a qualifying action through an affiliate link, at no additional cost to the user. Affiliate relationships do not determine our editorial conclusions.
What Is Futures Stacked Imbalance?
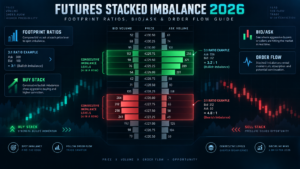
Futures Stacked Imbalance is a footprint/order-flow concept describing several nearby price rows in which the same side repeatedly dominates executed volume. On a bid/ask footprint, the left side typically represents volume executed at the bid by aggressive sellers, while the right side represents volume executed at the ask by aggressive buyers.
NinjaTrader describes an imbalance as a condition where ask volume at one price is significantly larger than bid volume at the price directly below it, or vice versa. Its current footprint education notes that traders commonly use a 3:1 ratio or higher as a starting threshold, while emphasizing that the threshold is adjustable.
A stack adds persistence across price. Instead of one isolated row showing unusually aggressive buying, several neighboring rows show the same directional condition. That creates evidence that aggressive participants did not act at only one tick—they repeatedly paid offers or hit bids through a price zone.
This distinction matters because one footprint row can become extreme from a small denominator, thin liquidity or a single burst of transactions. Futures Stacked Imbalance asks whether the directional asymmetry repeats across multiple levels.
Official reference:
NinjaTrader Footprint Charts Guide.
Futures Stacked Imbalance vs Order Book Imbalance
This page deliberately separates Futures Stacked Imbalance from order-book imbalance because they measure different market information.
| Metric | Data Source | What It Measures | Main Limitation |
|---|---|---|---|
| Footprint Imbalance | Executed bid/ask volume | Aggressive transactions at price | Past executions do not guarantee continuation |
| Stacked Imbalance | Several footprint rows | Repeated one-sided aggression across a zone | Can become trapped or absorbed |
| Order Book Imbalance | Resting market depth | Displayed bid-versus-ask liquidity | Orders can be canceled before execution |
A DOM can be bid-heavy while the footprint shows aggressive selling, because large passive bids can be receiving sell market orders. Conversely, executed buying can dominate even when visible ask liquidity is large.
For resting-depth analysis, use Futures Order Book Imbalance 2026. For the executed-volume layer, Futures Stacked Imbalance belongs with footprint, delta and order-flow analysis.
How Diagonal Bid/Ask Imbalance Works
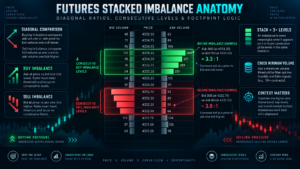
Many footprint platforms use a diagonal comparison because aggressive buying and selling interact across the spread. NinjaTrader’s current educational material describes buying imbalance by comparing ask volume at a price with bid volume directly below it, with the opposite comparison for selling imbalance.
Consider this simplified ES footprint:
| Price | Bid Volume | Ask Volume |
|---|---|---|
| 6501.00 | 42 | 390 |
| 6500.75 | 105 | 345 |
| 6500.50 | 92 | 318 |
| 6500.25 | 98 | 146 |
For a diagonal buying comparison, 318 contracts at the ask at 6500.50 might be compared with 98 contracts at the bid one tick lower at 6500.25. The ratio is about 3.24:1. If the platform threshold is 3:1, that row qualifies as a buying imbalance.
The same process can repeat at adjacent rows. When several same-direction imbalances cluster together, traders describe the area as Futures Stacked Imbalance.
The exact algorithm can vary between platforms. Some tools support diagonal, horizontal or custom comparisons, minimum-volume filters and tick aggregation. Never assume two footprint products are marking identical events simply because both use the word “imbalance.”
Futures Stacked Imbalance Ratio and Thresholds
There is no exchange-mandated Futures Stacked Imbalance threshold. Ratios are analytical settings chosen by the platform or trader.
NinjaTrader notes that many footprint traders use approximately 3:1 or higher to highlight significant imbalance. That does not make 300% universally optimal. A threshold that works well on ES during regular session hours can produce too many or too few signals on NQ, CL, GC or during thinner overnight periods.
| Setting | Lower Setting | Higher Setting |
|---|---|---|
| Imbalance Ratio | More sensitive, more signals | More selective, fewer signals |
| Minimum Volume | Can flag low-volume rows | Filters small-denominator noise |
| Rows Required for Stack | More frequent zones | Requires broader persistence |
| Ticks Per Row | More granular | More aggregation |
TradeboticsAI does not recommend optimizing a ratio until every historical trade looks perfect. That creates overfitting. A better process is to choose a transparent definition, apply it consistently, collect enough samples and compare results across market conditions.
Single Imbalance vs Stacked Imbalance
A single imbalance says that one comparison was unusually one-sided. A Futures Stacked Imbalance says the same directional aggression appeared repeatedly across a neighboring sequence of prices.
That extra persistence can matter because directional moves often require aggressive traders to keep crossing the spread as price advances or declines. A stack can therefore reveal a zone through which one side repeatedly demanded immediate execution.
But a stack should not be automatically labeled institutional activity. Exchange data generally does not identify whether the executions came from one large institution, many smaller traders, hedgers, algorithms or a mixture. The observable fact is aggressive transaction imbalance—not participant identity.
Similarly, stacked buying does not guarantee support later. Those buyers may already have exited, become trapped or be unwilling to defend the area. The market must prove the zone matters when price revisits it.
Buying vs Selling Stacked Imbalance
| Pattern | Aggressive Activity | Healthy Confirmation | Warning |
|---|---|---|---|
| Buy Stack | Buyers repeatedly lift offers | Price accepts higher and pullbacks hold | Large buy stack with no upward progress |
| Sell Stack | Sellers repeatedly hit bids | Price accepts lower and rallies fail | Large sell stack with no downward progress |
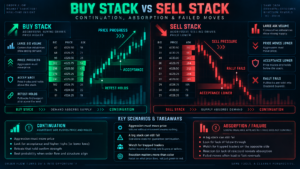
A bullish Futures Stacked Imbalance is strongest when aggressive buying and price behavior agree. Price should make progress, maintain acceptance and ideally defend the zone on a controlled retest.
A bearish stack is strongest when aggressive selling produces lower prices and the market continues conducting business below the zone.
The warning condition is the opposite: a huge buy stack at a session high that cannot push price higher may represent trapped buyers or absorption rather than continuation. The imbalance shows effort. Price response shows whether the effort succeeded.
Futures Stacked Imbalance: Continuation vs Absorption
The same Futures Stacked Imbalance pattern can precede continuation or reversal, depending on what happens to price.
Continuation
Buy imbalances appear through resistance, price expands, the market holds above the breakout and later retests the stack without significant sell-through. This sequence suggests the aggressive buying successfully shifted the auction higher.
Absorption
Buy imbalances appear at a high, but price barely advances despite substantial ask-side volume. A passive seller may be accepting the aggression. If price then drops back beneath the stack, the buyers who created the footprint can become vulnerable.
The same logic applies to sell stacks at lows. This is why Futures Stacked Imbalance should never be read without price progress.
For the effort-versus-result framework, see Futures Absorption Trading 2026. For fading activity rather than heavy absorbed activity, see Futures Exhaustion Trading 2026.
Futures Stacked Imbalance With Delta and Cumulative Delta
Stacked imbalance is a price-level condition. Bar delta and Cumulative Delta provide broader context.
A buy stack inside a bar can coexist with negative total bar delta if heavy selling occurred elsewhere in the same bar. Conversely, a positive-delta bar can contain important localized selling imbalance near its high.
That distinction is useful. Futures Stacked Imbalance tells the trader where repeated aggression occurred. Delta describes the net aggressive balance over a larger unit such as the whole bar or session.
Cumulative Delta can help determine whether the broader session flow agrees with the stack. A breakout with buy stacks, rising CVD and successful acceptance presents a more coherent continuation picture than a buy stack appearing while CVD diverges and price fails.
NinjaTrader explicitly warns against treating delta as a standalone directional signal. Use Futures Cumulative Delta 2026 for the dedicated methodology.
Where Stacked Imbalance Matters Most
Location separates useful order flow from endless footprint noise. Futures Stacked Imbalance has more analytical value when it occurs at a pre-defined area where the market is already making an important auction decision.
Examples include:
- prior-day high or low;
- overnight high or low;
- Value Area High or Value Area Low;
- POC or a major high-volume node;
- Initial Balance boundaries;
- VWAP or a predefined VWAP band;
- breakout and failed-breakout levels;
- low-volume nodes between accepted areas;
- previous stacked-imbalance zones being retested.
A stack in the middle of a balanced range may simply show a brief burst of aggression. The same stack breaking out of prior value and holding above VAH can provide much stronger evidence of initiative activity.
For location, combine this page with Futures Volume Profile 2026, Futures Market Profile 2026, Futures VWAP 2026 and Futures Auction Market Theory 2026.
TradeboticsAI Stacked Imbalance Quality Score
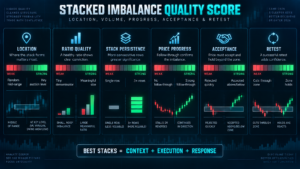
TradeboticsAI uses the following six-factor framework to distinguish a meaningful Futures Stacked Imbalance from a visually dramatic but low-information cluster. This is an editorial decision framework, not a guaranteed trading system.
| Factor | Weak | Strong |
|---|---|---|
| 1. Location | Random range midpoint | Pre-defined auction or breakout level |
| 2. Ratio Quality | Extreme ratio created by tiny denominator | Meaningful imbalance with adequate transaction size |
| 3. Stack Persistence | One isolated row | Several neighboring rows in same direction |
| 4. Price Progress | Aggression produces no progress | Price advances with the aggressive side |
| 5. Acceptance | Immediate rejection through zone | Time/volume develops in direction of stack |
| 6. Retest | Zone cuts through easily | Zone holds with renewed confirming flow |
The framework intentionally includes both transaction quality and auction response. A 500% ratio created by 5 contracts versus 1 contract may be less meaningful than a 320% ratio involving hundreds of contracts at a major level.
Practical Futures Stacked Imbalance Example: ES Breakout
Assume ES has traded below the prior-day high at 6,520.00 for most of the morning. Price approaches the level with increasing volume.
During the breakout bar, the footprint shows three adjacent buying imbalances from 6,520.00 through 6,520.50. Ask volume at each comparison is more than three times the corresponding diagonal bid volume, and the rows contain substantial contracts rather than single-digit prints.
The bar closes at 6,522.00 with positive delta. Cumulative Delta also rises. More importantly, ES does not immediately return below 6,520.00. The developing auction starts conducting business between 6,521.00 and 6,524.00.
This is a higher-quality Futures Stacked Imbalance continuation example because the aggressive buying produced price progress and acceptance.
Failed Version of the Same Setup
Now imagine the same buy stack prints above 6,520.00, but ES cannot trade beyond 6,520.75. Another wave of ask-side volume enters with little progress, and price closes back below 6,520.00.
The stack still proves that aggressive buyers traded there. What changed is the result. Their aggression was absorbed or failed to create acceptance. If selling then expands, the same Futures Stacked Imbalance can become evidence of trapped buyers instead of bullish continuation.
See Futures Trapped Traders 2026 for the failed-breakout framework.
Retesting a Stacked Imbalance Zone
Traders often extend a stacked zone forward and watch how price behaves when it returns. The idea is not that the zone possesses permanent support or resistance. It is that a meaningful burst of aggressive transactions occurred there, creating a reference worth testing.
A higher-quality bullish retest can include:
- price returns to a prior buy stack without slicing through immediately;
- sell volume increases but fails to create downside progress;
- bid-side selling becomes absorbed;
- new buying imbalance appears on the response;
- price reclaims the upper portion of the zone.
A failed retest occurs when sellers trade heavily through a prior buy stack and price accepts beneath it. The old aggressive buyers are no longer controlling the auction, and some may now be vulnerable.
The opposite logic applies to a sell stack. A Futures Stacked Imbalance zone should be treated as a reference whose validity must be retested, not as an automatic entry line.
Why Stacked Imbalance Setups Fail
1. The Ratio Is Large but the Volume Is Tiny
A 10:1 comparison can look impressive if the actual volumes are 10 and 1. Minimum-volume filters can reduce this problem.
2. Aggression Is Absorbed
A buy stack can represent real buying that runs directly into a larger passive seller. If price does not progress, the imbalance can become a reversal clue rather than continuation.
3. The Stack Appears in Poor Location
Every active session produces many imbalances. Futures Stacked Imbalance is generally more useful around meaningful auction references than in random rotation.
4. The Threshold Is Overfit
Changing ratio, row count and minimum volume until historical charts look perfect can create a strategy that fails out of sample.
5. Tick Aggregation Changes the Pattern
Combining several ticks into one footprint row changes the underlying comparisons. Document the chart configuration before comparing tests.
6. The Market Accepts Through the Zone
A previous buy stack does not remain support forever. Heavy selling and acceptance below it invalidates the original directional interpretation.
7. News Overwhelms Microstructure
Economic releases can rapidly change liquidity and participation. Short-term footprint zones can lose relevance during abrupt repricing.
8. Traders Confuse Effort With Outcome
The footprint proves that aggressive transactions occurred. It does not guarantee they were profitable or that price will continue in their direction.
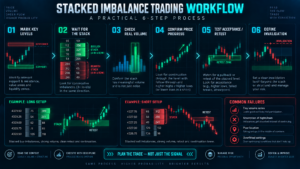
A Practical Futures Stacked Imbalance Trading Workflow
- Confirm the active contract. Use the futures expiration carrying meaningful volume and liquidity.
- Define chart methodology. Record BidAsk classification, ratio, minimum volume, tick aggregation and number of rows required for a stack.
- Mark important locations first. Use prior highs/lows, profile levels, VWAP or clearly defined breakout boundaries.
- Wait for the stack. Do not predict it before the transactions occur.
- Check actual volume. Reject visually extreme ratios built from insignificant trade counts.
- Measure price progress. Ask whether the aggressive side actually moved and held price.
- Check bar and session delta. Use delta as supporting context rather than a substitute for price response.
- Test auction acceptance. A continuation stack should generally build or preserve trade in its direction.
- Define invalidation. A clean failure through the zone should force reassessment.
- Review retests in replay or simulation. Build statistics for your instrument rather than relying on universal internet thresholds.
This workflow turns Futures Stacked Imbalance into a repeatable order-flow observation rather than a colored-cell signal.
Explore NinjaTrader Order Flow+ and practice footprint imbalance analysis in simulation
Data and Platform Requirements for Futures Stacked Imbalance
Futures Stacked Imbalance requires detailed price-level transaction data. Standard OHLC candles do not contain enough information to reconstruct bid-versus-ask volume at every price.
NinjaTrader calls its footprint charts Volumetric Bars and currently includes imbalance visualization within the Order Flow+ toolset. Its education pages state that Volumetric Bars show bid and ask volume at individual prices and can highlight imbalances using customizable thresholds. Current packaging can change, so verify product access directly with the platform before purchasing specifically for this feature.
Before relying on any footprint setup, verify:
- real-time exchange data availability;
- bid/ask trade classification method;
- historical tick-data quality;
- session template;
- tick aggregation;
- imbalance ratio;
- minimum-volume filters;
- stack definition;
- replay or simulation support.
For the broader data architecture behind order-flow tools, see Futures Level 2 Data 2026 and Futures Order Flow Trading 2026.
Pros and Limitations of Stacked Imbalance
Pros
- Shows repeated executed aggression across several price levels.
- More selective than reacting to one isolated imbalance.
- Can help confirm breakouts and momentum.
- Can create useful retest zones.
- Combines naturally with delta, CVD and Auction Market Theory.
- Provides transparent parameters that can be tested.
Limitations
- No universal best ratio or stack threshold exists.
- Aggressive flow can be absorbed.
- Small denominators can create misleading ratios.
- Settings differ between platforms.
- Historical footprint accuracy depends on data quality.
- Stacked zones do not guarantee future support or resistance.
Best For
Futures Stacked Imbalance is most useful for intraday futures traders who already understand footprint charts and want a disciplined way to identify repeated directional aggression at meaningful price locations.
Not Ideal For
It is less suitable for traders seeking an automatic buy/sell indicator, anyone without reliable transaction-level data, or longer-term strategies where tick-by-tick footprint detail adds little decision value.
Futures Stacked Imbalance FAQ
What is Futures Stacked Imbalance?
Futures Stacked Imbalance describes several neighboring footprint-chart price rows showing the same directional executed-volume imbalance, indicating repeated aggressive buying or selling across a zone.
What is an imbalance on a footprint chart?
An imbalance occurs when one side of executed volume materially exceeds the opposing comparison. NinjaTrader describes a common diagonal method comparing ask volume at one level with bid volume directly below it, or vice versa.
What ratio should I use for footprint imbalance?
NinjaTrader notes that many traders use approximately 3:1 or higher as a starting point. No ratio is universally optimal; instrument, session, minimum volume and chart aggregation all matter.
How many rows make a stacked imbalance?
Platforms and traders define this differently. The general concept is multiple consecutive same-direction imbalanced rows. Use a fixed rule in testing instead of changing it after seeing the chart.
Is a buy stacked imbalance always bullish?
No. Aggressive buying can be absorbed by passive sellers. Futures Stacked Imbalance becomes bullish only when the auction also demonstrates successful price progress and acceptance.
Is a sell stacked imbalance always bearish?
No. Aggressive selling can fail at a low and create trapped shorts. Price response determines whether the stack represents continuation or failed aggression.
What is the difference between stacked imbalance and delta?
Stacked imbalance is localized across individual price rows. Delta summarizes the difference between ask-side and bid-side executed volume over a larger unit such as a bar or session.
What is the difference between footprint imbalance and order-book imbalance?
Footprint imbalance uses completed transactions. Order-book imbalance compares displayed resting bid and ask liquidity. They measure different stages of the market process.
Can stacked imbalance act as support or resistance?
Traders often monitor previous stacks as potential reaction zones, but the level must be retested. A stack can fail completely when opposite aggression trades through it and the market accepts beyond the zone.
Can stacked imbalances identify trapped traders?
Yes, when strong aggressive imbalance occurs but price fails and reverses through the zone. The footprint shows participation; the failure suggests those recent participants may be poorly positioned.
Does NinjaTrader support footprint imbalance?
Yes. NinjaTrader’s Volumetric Bars are its footprint-style chart and current Order Flow+ material documents bid/ask volume, delta and imbalance visualization. Verify current feature packaging directly with NinjaTrader.
Can Futures Stacked Imbalance predict price?
No. Futures Stacked Imbalance measures executed aggression. It does not reveal future orders, guarantee continuation or prevent the aggressive side from being absorbed or trapped.
Final Verdict: How to Use Futures Stacked Imbalance Correctly
Futures Stacked Imbalance is valuable because it adds persistence to footprint analysis. Instead of reacting to one unusually lopsided row, the trader asks whether aggressive buyers or sellers repeatedly dominated executions through several neighboring prices.
The raw pattern is only the first layer. A stack becomes more useful when it occurs at a meaningful location, involves significant transaction volume, produces price progress and is followed by acceptance. A dramatic stack that fails to move price can be equally valuable—but as evidence of absorption, exhaustion or trapped traders rather than continuation.
The strongest TradeboticsAI sequence is:
location → meaningful ratio → multiple same-direction rows → price progress → acceptance → retest confirmation.
Use Futures Stacked Imbalance alongside Futures Footprint Charts, Futures Order Flow Trading, Cumulative Delta, Absorption Trading and Trapped Traders. The objective is not to follow colored footprint cells mechanically; it is to determine whether repeated aggressive transactions actually changed the auction.
Explore NinjaTrader for Volumetric Bars, Cumulative Delta and futures simulation
Affiliate Disclosure: TradeboticsAI may receive compensation when eligible users complete a qualifying action through certain affiliate links. Affiliate relationships do not determine our editorial conclusions.
Risk Disclosure: Futures trading involves substantial risk of loss and is not suitable for every investor. Footprint imbalance, stacked imbalance, delta, Cumulative Delta, absorption, trapped-trader analysis and historical order-flow patterns do not predict future returns. Aggressive flow can be absorbed, market conditions can change rapidly, and simulated results do not guarantee future live performance. Nothing on this page is personalized investment, financial, tax or trading advice.