Futures Order Book Imbalance 2026: Bid/Ask Ratio, Depth & Trading Guide
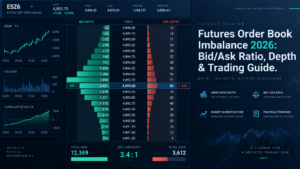
Futures Order Book Imbalance measures the asymmetry between displayed buy and sell liquidity in a futures limit order book. When substantially more contracts are resting on the bid than on the ask—or the opposite—the DOM is temporarily unbalanced. Traders can quantify that difference with bid/ask ratios or normalized imbalance formulas, then compare the result with actual executions, price response, MBO data and broader market structure. The key is that displayed liquidity is dynamic: orders can be added, canceled or executed, so imbalance should be treated as context rather than a guaranteed prediction.
Quick Answer
Futures Order Book Imbalance compares resting bid quantity with resting ask quantity over one or more price levels. A common normalized formula is (Bid Depth − Ask Depth) ÷ (Bid Depth + Ask Depth), producing a value from -1 to +1. Positive readings mean displayed bid liquidity is larger; negative readings mean displayed ask liquidity is larger. The number becomes more useful when it persists, occurs near an important price and is confirmed by executions and price behavior. It is not a standalone buy or sell signal.
Explore NinjaTrader for futures DOM, order-flow analysis and simulated trading
Affiliate Disclosure: TradeboticsAI may earn compensation when an eligible user completes a qualifying action through an affiliate link, at no additional cost to the user. Affiliate relationships do not determine our editorial conclusions.
What Is Futures Order Book Imbalance?
Futures Order Book Imbalance is a quantitative description of how unevenly displayed liquidity is distributed between bids and offers. The futures order book contains unmatched limit orders waiting to trade. Bid orders represent displayed willingness to buy at specific prices, while ask orders represent displayed willingness to sell.
CME Group describes its electronic limit order book as being updated whenever orders are created, trades occur or orders are canceled. CME liquidity methodology tracks information including bid prices, ask prices, bid quantities, ask quantities and numbers of orders across multiple levels of the book.
That constant updating explains why Futures Order Book Imbalance can change extremely quickly. A book that contains 1,500 displayed contracts on the bid and only 600 on the ask can become balanced seconds later if participants cancel bids, add offers or execute against existing liquidity.
The metric therefore measures the current displayed state of the book—not future market direction and not hidden participant intent.
Official reference:
CME Group Liquidity Tool methodology.
Futures Order Book Imbalance Formula
A common normalized Futures Order Book Imbalance formula is:
OBI = (Bid Quantity − Ask Quantity) ÷ (Bid Quantity + Ask Quantity)
The result ranges between -1 and +1.
| Bid Depth | Ask Depth | OBI | Displayed Book State |
|---|---|---|---|
| 1,500 | 500 | +0.50 | Bid-heavy |
| 1,000 | 1,000 | 0.00 | Balanced |
| 500 | 1,500 | -0.50 | Ask-heavy |
For the first example:
(1,500 − 500) ÷ (1,500 + 500) = +0.50
A +0.50 reading means the measured bid quantity is three times the ask quantity, but that does not mean price must rise. Those 1,500 displayed bid contracts can be canceled, executed or replaced. Aggressive sellers may also be large enough to consume them.
The formula is useful because it normalizes different book sizes onto a common scale. A raw difference of 500 contracts means something different in a 1,000-contract book than in a 20,000-contract book.
Futures Order Book Imbalance should therefore be interpreted as an asymmetry measurement, not as a directional promise.
Top-of-Book vs Multi-Level Futures Order Book Imbalance
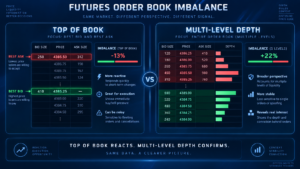
There is no single universal way to calculate Futures Order Book Imbalance. The result depends on which book levels are included.
Top-of-Book Imbalance
The simplest version compares only the best bid and best ask. If ES shows 320 contracts at the best bid and 120 at the best offer:
OBI = (320 − 120) ÷ (320 + 120) ≈ +0.455
This method reacts quickly to changes at the inside market, which can be useful for very short-term execution analysis. Its weakness is sensitivity. One order cancellation can radically change the result.
Multi-Level Imbalance
A broader calculation sums several price levels:
Multi-Level OBI = (Σ Bid Depth − Σ Ask Depth) ÷ (Σ Bid Depth + Σ Ask Depth)
Suppose the first five levels contain:
| Level | Bid Quantity | Ask Quantity |
|---|---|---|
| 1 | 320 | 120 |
| 2 | 280 | 175 |
| 3 | 240 | 210 |
| 4 | 210 | 250 |
| 5 | 190 | 310 |
Total bid depth is 1,240 and total ask depth is 1,065. The five-level OBI is approximately +0.076—much closer to balance than the +0.455 top-of-book reading.
This illustrates an important point: a strongly bid-heavy best price does not necessarily mean the broader book is strongly bid-heavy.
Futures Order Book Imbalance: MBO vs MBP Data
The quality of Futures Order Book Imbalance analysis depends on the market-data format being used.
CME Group distinguishes Market by Price (MBP) from Market by Order (MBO). MBP consolidates quantities at each price level. CME states that MBP updates are restricted to a maximum of ten levels and do not provide accurate individual queue position or individual order sizes.
MBO provides greater granularity: individual order sizes, queue position and full depth of book where supported.
| Feature | MBP | MBO |
|---|---|---|
| Quantity | Aggregated by price | Individual order detail |
| Queue position | Limited | More transparent |
| Depth | Price-level aggregation | Order-level depth |
| Iceberg analysis | Mostly inferred | Native refresh analysis can be stronger |
Official reference:
CME Group Market by Order FAQ.
For deeper hidden-liquidity analysis, see our Futures Iceberg Orders 2026 guide.

How to Interpret Futures Order Book Imbalance
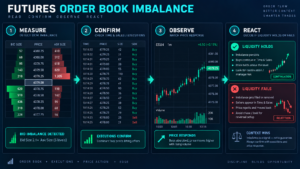
A positive Futures Order Book Imbalance means the measured displayed bid depth exceeds ask depth. A negative reading means the opposite. The useful question is not simply which sign is showing, but whether the imbalance persists and how price responds.
| Book | Executions | Price Response | Possible Interpretation |
|---|---|---|---|
| Bid-heavy | Buyers remain aggressive | Price rises | Book and execution pressure broadly align |
| Bid-heavy | Heavy selling hits bids | Price holds | Possible passive buy absorption |
| Bid-heavy | Heavy selling | Price falls through bids | Displayed bids failed to stop aggressive sellers |
| Ask-heavy | Heavy buying lifts offers | Price stalls | Possible passive sell absorption |
| Rapidly flipping | Mixed | Rotational | Low-confidence short-term signal |
A persistent imbalance can be more meaningful than a one-update spike. For example, a bid-heavy reading that survives repeated selling and replenishes near a major support area contains more information than one large bid that disappears before price reaches it.
Futures Order Book Imbalance therefore becomes stronger when combined with persistence, execution and market location.
Futures Order Book Imbalance and Microprice
A related market-microstructure concept is the microprice, an imbalance-adjusted estimate based on the best bid, best ask and displayed quantities.
A common top-of-book formula is:
Microprice = (Ask Price × Bid Size + Bid Price × Ask Size) ÷ (Bid Size + Ask Size)
Suppose ES shows:
- Best bid: 6,500.00 × 300 contracts
- Best ask: 6,500.25 × 100 contracts
The mid-price is 6,500.125. The microprice is approximately 6,500.1875—closer to the ask because displayed bid quantity is larger.
This does not mean ES must trade upward. It provides a compact way to combine inside-market price and quantity asymmetry.
A useful distinction is that Futures Order Book Imbalance tells you how asymmetrical the displayed quantities are, while microprice translates that asymmetry into an adjusted price reference.
Both are sensitive to cancellations and rapid order-book changes, so neither should be used independently of executed flow.
TradeboticsAI Futures Order Book Imbalance Quality Matrix
TradeboticsAI uses the following framework to distinguish a meaningful order-book condition from ordinary DOM noise. This is an editorial analysis framework, not an exchange-certified trading signal.
| Evidence | Weak | Medium | Strong |
|---|---|---|---|
| Magnitude | Small asymmetry | Clear imbalance | Large normalized imbalance |
| Persistence | One update | Several updates | Sustained through executions |
| Location | Random midpoint | Intraday reference | Major prior high/low, VWAP, VAH/VAL or breakout |
| Executed Flow | No confirmation | Some alignment | Tape/footprint confirms pressure or absorption |
| Price Response | No clear reaction | Initial reaction | Acceptance or rejection confirms hypothesis |
The information gain here is simple: magnitude alone is not enough. A large Futures Order Book Imbalance that lasts milliseconds at a random price is usually less useful than a moderate imbalance that persists while actual orders trade at a meaningful level.
Practical Futures Order Book Imbalance Example: ES
Consider a hypothetical ES session approaching prior-day VAH at 6,620.00.
The first three bid levels total 1,050 contracts, while the first three ask levels contain 450:
OBI = (1,050 − 450) ÷ (1,050 + 450) = +0.40
At first glance, the book is clearly bid-heavy. But this does not justify an automatic long trade.
Scenario A: Imbalance Confirms the Move
Ask-side trades begin accelerating. The large bid quantities remain instead of being canceled. Price trades above 6,620.00, new bids form beneath the breakout and Time & Sales continues printing above the former resistance.
Here, Futures Order Book Imbalance, actual execution and price response are broadly aligned.
Scenario B: Bid Liquidity Is Pulled
As price reaches 6,619.75, several hundred bid contracts disappear before being executed. OBI rapidly falls from +0.40 to -0.05. Sellers begin hitting the remaining bids and ES drops back toward 6,617.00.
The earlier positive imbalance was real as a snapshot, but the liquidity was not persistent.
Scenario C: Sellers Hit a Large Bid but Price Holds
Heavy selling trades into the bid at 6,619.00. More contracts execute there than were initially displayed, yet price cannot move lower. The bid repeatedly replenishes.
This may represent hidden liquidity or absorption and requires a different interpretation from Scenario A or B. See our Futures Iceberg Orders 2026 guide for the hidden-liquidity layer.
Futures Order Book Imbalance, Icebergs and Replenishment
An important limitation of Futures Order Book Imbalance is that it measures displayed liquidity. Hidden liquidity can materially change what happens after market orders arrive.
Suppose the ask side looks thin with only 80 contracts displayed, creating a strongly positive OBI. Buyers begin lifting those offers, but the same price repeatedly refreshes. Hundreds of contracts trade without a meaningful advance.
The displayed book initially suggested limited sell liquidity. Actual execution revealed that more passive supply existed than the snapshot showed.
This is why the order book should be paired with:
- Time & Sales;
- footprint charts;
- Cumulative Delta;
- MBO where available;
- price response.
Use our Futures Time and Sales 2026, Futures Footprint Charts 2026 and Futures Cumulative Delta 2026 guides for those complementary layers.
Explore NinjaTrader for futures DOM, charts and simulated order-flow analysis
A Practical Futures Order Book Imbalance Trading Workflow
- Confirm the active contract. During rollover, make sure the contract still carries the relevant liquidity.
- Define the measurement. Decide whether OBI uses top-of-book, three levels, five levels or another fixed depth.
- Normalize the result. Use a consistent formula so readings can be compared across time.
- Mark important market locations. Prior highs/lows, VWAP, VAH, VAL, POC and Initial Balance provide context.
- Measure persistence. A transient imbalance is less meaningful than one that survives multiple updates and executions.
- Watch cancellations. Determine whether displayed liquidity remains when price approaches.
- Compare with executed flow. Use Time & Sales or footprint data to see what actually trades.
- Observe price response. Strong imbalance without corresponding movement may indicate absorption or hidden liquidity.
- Define invalidation. Order-book asymmetry does not replace stop placement or position sizing.
- Review and record. Save screenshots or data so thresholds can be evaluated rather than chosen retrospectively.
This process makes Futures Order Book Imbalance measurable and repeatable rather than turning the DOM into a subjective stream of flashing numbers.
Common Futures Order Book Imbalance Mistakes
1. Buying Every Positive Imbalance
Positive OBI means displayed bids exceed displayed asks. Those bids can be canceled or consumed. It is not an automatic long signal.
2. Selling Every Negative Imbalance
Displayed ask depth can disappear just as quickly. Negative Futures Order Book Imbalance is a book condition, not a guaranteed forecast.
3. Using Only One Book Update
High-frequency order placement and cancellation can make individual snapshots noisy. Persistence generally contains more information.
4. Ignoring Hidden Liquidity
An apparently thin side of the book can replenish repeatedly through iceberg or algorithmic behavior.
5. Comparing Different Depth Windows
A one-level OBI and a ten-level OBI are different metrics. Thresholds cannot be compared unless the measurement method is consistent.
6. Treating Book Depth as Total Liquidity
CME research explicitly warns that order-book depth alone does not fully measure liquidity. Fill quality, traded volume, spread and price impact also matter.
7. Ignoring Rollover
A thin expiring contract can show extreme imbalance simply because liquidity has already migrated to the next expiration.
8. Ignoring Execution
Resting orders show intention to provide liquidity at that moment. Actual trades reveal whether that liquidity survives contact with aggressive flow.
Pros and Limitations of Futures Order Book Imbalance
Pros
- Quantifies bid-versus-ask asymmetry.
- Can be normalized across different book sizes.
- Useful for short-term execution context.
- Can reveal persistent stacking or pulling behavior.
- Pairs naturally with DOM, tape and MBO data.
- Can be incorporated into systematic microstructure research.
Limitations
- Measures displayed rather than total hidden liquidity.
- Orders can be canceled before execution.
- Results depend on how many levels are measured.
- Extreme readings can disappear instantly.
- Different feeds expose different levels of order-book detail.
- Order-book depth alone does not fully represent liquidity.
Who Is Futures Order Book Imbalance Best For?
Futures Order Book Imbalance is most useful for active futures traders, scalpers, quantitative researchers and execution-focused traders who already understand DOM structure and want a repeatable method for measuring displayed liquidity asymmetry.
It is less useful for longer-term traders who do not need second-by-second market-depth information. It is also not ideal as a beginner’s first trading indicator because the underlying data changes quickly and can be misleading without knowledge of executions, queue behavior and hidden liquidity.
For foundational DOM mechanics, see Futures DOM Trading 2026. For volume-weighted market location, see Futures VWAP 2026.
Futures Order Book Imbalance FAQ
What is Futures Order Book Imbalance?
Futures Order Book Imbalance measures the difference between displayed bid liquidity and displayed ask liquidity over one or more levels of a futures limit order book.
What is the order book imbalance formula?
A common normalized formula is (Bid Quantity − Ask Quantity) ÷ (Bid Quantity + Ask Quantity). The result ranges from -1 to +1.
What does positive order book imbalance mean?
A positive value means the measured displayed bid quantity is greater than the displayed ask quantity. It does not guarantee that price will rise.
What does negative order book imbalance mean?
A negative value means displayed ask depth is greater than displayed bid depth over the selected measurement window. Orders can still be canceled, executed or replaced.
Should I measure only the best bid and ask?
Top-of-book measurements react quickly but can be noisy. Multi-level calculations are broader and often more stable. The important requirement is to use a consistent definition.
Can order book imbalance predict price?
No. Futures Order Book Imbalance can provide short-term market-microstructure context, but the displayed book can change rapidly and hidden liquidity can alter the result.
What is the difference between MBO and MBP?
Market by Price aggregates quantity at price levels. Market by Order provides more granular order-level information, including individual order sizes and queue information where supported.
What is microprice?
Microprice is an imbalance-adjusted top-of-book price estimate that combines best bid, best ask and their displayed sizes. It is a market-microstructure reference, not a guaranteed forecast.
Does a large bid mean support?
No. A large bid is displayed liquidity at a point in time. It can trade, replenish or disappear before execution. Price behavior and actual transactions matter more than size alone.
Can iceberg orders distort order book imbalance?
Yes. Because ordinary OBI is based on displayed depth, hidden or replenishing liquidity can make one side appear thinner than the amount of passive liquidity actually available.
Is book depth the same as liquidity?
No. CME Group notes that book depth in isolation is not a complete liquidity measure. Spread, fill quality, traded volume and price impact also matter.
Is Futures Order Book Imbalance useful for scalping?
It can provide useful short-term execution context for scalpers, especially when combined with market location, DOM behavior and actual executed flow. It should not be used as a standalone entry signal.
Final Verdict: How to Use Futures Order Book Imbalance Correctly
Futures Order Book Imbalance turns a rapidly changing DOM into a measurable comparison between displayed buy-side and sell-side liquidity. That makes it more disciplined than simply looking at the ladder and deciding one side “looks bigger.”
The calculation itself is easy. The difficult part is interpretation. A strong positive value can vanish when bids are pulled. A negative value can coexist with hidden buy liquidity. A seemingly thin offer can absorb hundreds of aggressive purchases through replenishment.
The strongest process therefore combines imbalance magnitude with persistence, market location, MBO or MBP context, Time & Sales, footprint data and the actual resulting price move.
Use Futures Order Book Imbalance to measure the book—not to pretend the book knows the future.
Explore NinjaTrader for futures DOM, charting, order flow and simulation
Affiliate Disclosure: TradeboticsAI may receive compensation when eligible users complete a qualifying action through certain affiliate links. Affiliate relationships do not determine our editorial conclusions.
Risk Disclosure: Futures trading involves substantial risk of loss and is not suitable for every investor. Order book imbalance, DOM depth, MBO data, microprice, hidden-liquidity analysis and historical order-flow behavior do not predict future returns. Displayed orders can be modified or canceled, and simulated results do not guarantee future live performance. Nothing on this page is personalized investment, financial, tax or trading advice.