Futures Footprint Charts 2026: Bid/Ask, Delta & Imbalance Guide
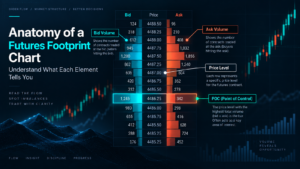
Futures Footprint Charts open each price bar and show how trading volume was distributed at individual price levels inside that bar. Instead of seeing only open, high, low and close, traders can inspect bid-side volume, ask-side volume, delta, imbalances, Point of Control (POC), volume clusters and other order-flow details. For active futures traders, this can provide a more granular view of how aggressive buyers and sellers interacted at a level, but the information should be used as context rather than as a guaranteed entry signal.
Quick Answer
Futures Footprint Charts display traded volume at each price inside a bar. Bid-side volume generally represents aggressive sellers trading into resting bids, while ask-side volume represents aggressive buyers trading into resting offers. Delta is commonly calculated as ask volume minus bid volume. Imbalance highlights unusually one-sided activity at selected price levels. Footprints can help analyze aggression, absorption, exhaustion and failed auctions, but they do not reveal trader intent with certainty and should be combined with price structure, liquidity and risk management.
Explore NinjaTrader for futures charts, simulation and Order Flow+ tools
Affiliate Disclosure: TradeboticsAI may earn compensation when an eligible user completes a qualifying action through an affiliate link, at no additional cost to the user. Affiliate relationships do not determine our editorial conclusions.
What Do Futures Footprint Charts Show?
Futures Footprint Charts are order-flow charts that break a bar into price rows. NinjaTrader calls its footprint-style implementation Volumetric Bars and states that the tool can display bid and ask volume at each price while also supporting order-flow imbalance and market delta analysis. TradingView similarly describes its Volume Footprint chart as a visualization of volume distributed across price levels inside each candle.
The advantage is information density. A normal five-minute ES candle might tell you that price opened at 6,600.00, traded to 6,608.00, reached 6,596.00 and closed at 6,605.00. It does not tell you whether most transactions occurred near the high, whether aggressive selling dominated the low, or whether buyers repeatedly lifted offers without producing much additional price movement.
Futures Footprint Charts can expose those internal relationships. Depending on the platform and display mode, a trader may see bid volume, ask volume, total volume, delta, bar POC, value area, imbalances, cumulative delta or other order-flow statistics.
Official reference:
NinjaTrader Order Flow Trading & Volumetric Bars.
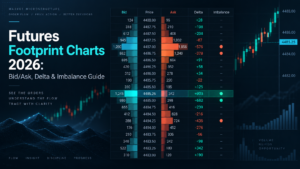
Futures Footprint Charts: How Bid × Ask Works
A common Futures Footprint Charts layout displays two numbers at each price level. The left side represents volume associated with sellers trading into bids, while the right side represents volume associated with buyers trading into offers. Platforms may use slightly different terminology, so always verify the data model in the software documentation.
| Price | Bid Volume | Ask Volume | Row Delta | Possible Context |
|---|---|---|---|---|
| 6,605.00 | 118 | 356 | +238 | Ask-side aggression dominates this row |
| 6,604.75 | 241 | 265 | +24 | More balanced activity |
| 6,604.50 | 402 | 121 | -281 | Bid-side aggression dominates this row |
The table does not identify “smart money” or guarantee who will win the next move. Every completed futures trade requires both sides. The footprint is most useful for describing which side paid for immediacy and how price responded to that aggressive activity.
That price response matters. Heavy aggressive buying that immediately advances price has different context from heavy aggressive buying that repeatedly fails to lift the market. The second condition may suggest that passive sellers are absorbing the buying pressure.
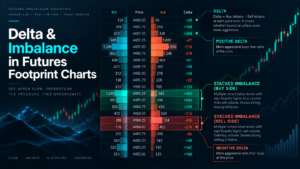
Delta in Futures Footprint Charts
Delta is one of the most important calculations in Futures Footprint Charts. A common convention is:
Delta = Ask Volume − Bid Volume
If 2,400 contracts trade on the ask and 1,700 trade on the bid during a bar, bar delta is +700. If ask volume is 1,500 and bid volume is 2,300, delta is -800. Positive delta indicates greater aggressive buying volume under that convention; negative delta indicates greater aggressive selling volume.
TradingView also displays delta percentage using:
Delta % = Delta ÷ Total Volume × 100
This makes it easier to compare bars of different total volume. A +500 delta on 1,000 total contracts is structurally different from +500 on 20,000 contracts.
Delta Divergence
Futures Footprint Charts can also reveal disagreement between price direction and aggressive volume. For example, price might print a new local high while delta becomes less positive or turns negative. That does not guarantee a reversal. It simply tells the trader that price and measured aggression are no longer confirming one another as cleanly.
TradingView’s official documentation specifically warns that delta divergence should be considered with additional evidence. TradeboticsAI treats it as a diagnostic clue, not a standalone buy or sell rule.
Futures Footprint Charts: Imbalance and Stacked Imbalance
Imbalance analysis compares buying and selling activity at nearby price levels. TradingView documents a diagonal comparison: buy volume at one level is compared with sell volume at the level below, while sell volume at one level is compared with buy volume at the level above.
The platform allows the imbalance threshold to be configured and documents a 300% default, meaning one side must be at least three times the compared opposite-side volume to meet that threshold. This is a software setting, not a universal market law.
Consider a simplified example:
| Comparison | Large Side | Opposite Side | Ratio | 300% Threshold? |
|---|---|---|---|---|
| Buy vs lower sell | 450 | 120 | 3.75× | Yes |
| Sell vs upper buy | 270 | 130 | 2.08× | No |
A stacked imbalance occurs when multiple consecutive rows show imbalance in the same direction. Futures Footprint Charts make these sequences visually obvious, which can help a trader identify concentrated aggressive participation.
However, an imbalance can fail immediately. Large aggressive buying can be absorbed by resting sellers, and large aggressive selling can be absorbed by resting buyers. The number itself is not enough; price response is part of the signal.
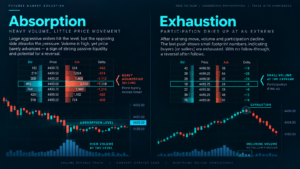
Absorption and Exhaustion in Futures Footprint Charts
Two of the most frequently discussed Futures Footprint Charts concepts are absorption and exhaustion. They are related to aggressive order flow but describe different conditions.
Absorption
Absorption occurs when substantial aggressive buying or selling is transacted but price makes limited progress through the level. The idea is that passive liquidity on the opposite side is absorbing the aggressive orders. For example, repeated heavy ask-side volume near a resistance area with little upward movement may suggest that sellers are meeting the buying pressure.
Absorption is inferred from the combination of volume and price response. A footprint does not directly label the identity or motive of the passive participant. This distinction matters because the same large print can have very different meaning depending on what price does immediately afterward.
Exhaustion
Exhaustion is different. It describes a reduction or disappearance of aggressive participation near an extreme. TradingView notes that complete auctions can show zero or minimal purchases at a low or minimal sales at a high. Traders often interpret this as evidence that the auction has run out of immediate participation at the extreme.
An incomplete or unfinished auction can show a less decisive imbalance at the high or low. Futures Footprint Charts can make these extremes easier to inspect, but there is no guarantee that an unfinished auction must be revisited during the next session.
POC and Volume Clusters Inside Futures Footprint Charts
Many Futures Footprint Charts identify a Point of Control for each bar: the price row with the greatest amount of traded volume inside that footprint. This is different from a session Volume Profile POC, which evaluates a broader selected range rather than one individual bar.
A bar POC can help answer where the most business occurred inside that candle. Several nearby bar POCs forming at similar prices can show repeated transaction concentration, but the meaning depends on context. A cluster inside a balanced range is not the same as a cluster created during a breakout or at a prior session extreme.
For broader volume-at-price analysis, use our Futures Volume Profile 2026 guide. For time-at-price structure, use Futures Market Profile 2026. Those tools solve related but different problems.
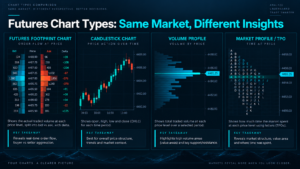
Futures Footprint Charts vs Other Futures Charts
| Chart | Primary Data | Best Question | Main Limitation |
|---|---|---|---|
| Candlestick | OHLC price | How did price move? | Hides internal transaction distribution |
| Footprint | Volume inside each bar by price and side | How was the bar transacted? | Can become noisy and data-intensive |
| Volume Profile | Volume by price across a selected range | Where did the market trade most volume? | Does not show each bar’s bid/ask sequence |
| Market Profile / TPO | Time at price | Where did price spend time? | Not a direct measure of traded contracts |
Futures Footprint Charts are therefore best treated as a microstructure layer. Market Profile can establish the session’s auction structure, Volume Profile can identify broader transaction concentration, and footprints can inspect the detailed activity inside the bars that interact with those levels.
If you are comparing software capable of displaying these tools, see our Best Footprint Chart Platforms 2026 guide.
Practical Futures Footprint Charts Example: ES
Consider a hypothetical ES setup around a prior session VAH at 6,620.00. Price opens above that level and later pulls back toward 6,620.00. A trader wants to know whether the pullback is being accepted below prior value or whether sellers are failing to push through the level.
At 6,620.00 the footprint prints 620 contracts on the bid and 180 on the ask. At 6,619.75 it prints 540 bid and 150 ask. The numbers show aggressive selling. But instead of continuing lower, price remains above 6,619.50 and the next bar closes back above 6,622.00 with positive delta.
A simplistic interpretation would say “negative delta is bearish.” A more useful Futures Footprint Charts interpretation is that sellers were aggressive, yet price failed to travel far through the reference level. That combination can be consistent with absorption by passive buyers.
The trade still requires an invalidation point. If entry is considered at 6,622.25 and the thesis is invalid below 6,618.75, the risk is 3.50 ES points, or 14 ticks. The footprint does not decide whether that risk is suitable for the account.
Use our Futures Contract Specifications 2026 guide to verify tick size and tick value before converting a footprint setup into dollar risk.
A Practical Futures Footprint Charts Trading Workflow
Use this process to keep Futures Footprint Charts from becoming a screen full of unexplained numbers:
- Start with location. Identify a reason to care about the price area before reading microstructure: prior high/low, VAH, VAL, POC, VWAP, Initial Balance or another defined reference.
- Confirm the active contract. Near rollover, make sure volume has not migrated to another expiration.
- Choose the footprint mode. Bid × Ask, delta and total-volume views answer different questions.
- Set row size deliberately. Excessive aggregation can hide detail; too little aggregation can make the display unreadable.
- Observe aggression. Note whether buyers or sellers dominate the relevant rows.
- Compare aggression with price response. Strong aggression with little price progress can be more informative than the raw number alone.
- Check imbalance sequences. Record whether imbalances are isolated or stacked across consecutive rows.
- Evaluate delta in context. Compare bar delta with price movement and nearby structure.
- Define invalidation. A footprint pattern without a risk level is not a complete trade plan.
- Review in simulation first. Order-flow tools have a learning curve, and replay or simulation can reduce the cost of learning.
Explore NinjaTrader for footprint-style Volumetric Bars and simulated futures trading
Data Requirements for Futures Footprint Charts
Futures Footprint Charts depend heavily on data quality and platform methodology. NinjaTrader emphasizes the usefulness of centralized futures exchange data for order-flow analysis. TradingView documents that its Volume Footprint calculations can use lower intrabar intervals and that historical precision can change as more granular data becomes unavailable farther back in history.
This means two footprint charts are not guaranteed to match perfectly if they use different feeds, row aggregation, historical-resolution rules or buy/sell classification methods. Traders comparing platforms should verify:
- the exchange market-data feed;
- real-time vs delayed data;
- bid/ask or buy/sell classification method;
- ticks per row;
- footprint type;
- imbalance threshold;
- session template;
- historical data granularity;
- whether calculations can repaint or be recomputed historically.
TradingView explicitly notes that its footprint can recalculate historical bars using a different intrabar resolution than was available in real time, which can slightly change historical imbalances. That is a good example of why screenshots should not be treated as immutable raw truth.
For broader participation context, compare footprint information with Futures Open Interest 2026.
Common Futures Footprint Charts Mistakes
1. Trading Every Imbalance
An imbalance is a measurement of disproportionate activity, not a guaranteed continuation signal. Context and price response remain essential.
2. Assuming Positive Delta Is Automatically Bullish
Positive delta means aggressive buying exceeded aggressive selling under the chosen calculation. If price cannot rise despite that aggression, the result can be more interesting than the positive number itself.
3. Confusing Absorption With Exhaustion
Absorption involves meaningful aggressive activity being met by passive liquidity. Exhaustion involves aggressive activity drying up. The two can occur near similar locations but describe different mechanics.
4. Ignoring Data Methodology
Futures Footprint Charts can differ between platforms because of row sizing, data classification, aggregation and historical-resolution choices. Compare like with like.
5. Zooming Out Until the Numbers Lose Meaning
Footprints are dense. If many bars and price rows are compressed into one screen, the trader may lose the microstructure detail the chart was supposed to provide.
6. Using Order Flow Without Market Location
A stacked imbalance in the middle of a random range may have less value than the same pattern at a well-defined prior-session reference. Start with market structure, then use the footprint to inspect the interaction.
7. Treating Simulation as Live Performance
Simulation can help traders learn the software and build a repeatable process, but simulated fills and decision-making do not replicate all live trading conditions.
Pros and Limitations of Futures Footprint Charts
Pros
- Shows executed activity inside individual bars.
- Separates aggressive bid-side and ask-side volume.
- Makes delta and imbalance visible at price-level resolution.
- Can help distinguish aggression from actual price response.
- Complements Volume Profile and Market Profile.
- Useful for active futures scalping and day-trading research.
Limitations
- High information density creates a steep learning curve.
- Platform calculations and feeds can differ.
- Imbalances can fail immediately.
- Passive participant intent is inferred, not directly known.
- Historical calculations may differ from real-time calculations on some platforms.
- Footprints do not replace risk management or broader structure.
Who Are Footprint Charts Best For?
Futures Footprint Charts are best suited to active traders who already understand the contract they trade and want additional transaction-level context around entries, breakouts, reversals or key auction levels. They are particularly relevant for intraday ES, NQ, MES, MNQ, CL, GC and other liquid centralized futures markets.
They are less useful for traders who primarily hold positions for weeks or months, or for beginners who have not yet mastered contract specifications, position sizing and session structure. Adding more numbers to the screen does not create an edge by itself.
Futures Footprint Charts FAQ
What are Futures Footprint Charts?
Futures Footprint Charts display traded activity at individual price levels inside each bar. Depending on the platform, they can show bid volume, ask volume, delta, total volume, POC, value area and imbalance information.
What is bid volume on a footprint chart?
In a standard bid/ask footprint convention, bid-side volume represents aggressive selling transacted against resting bid orders. Verify the convention used by your platform.
What is ask volume on a footprint chart?
Ask-side volume commonly represents aggressive buying transacted against resting offers. The exact naming or classification method can differ by software.
What is footprint delta?
A common calculation is ask volume minus bid volume. Positive delta means greater ask-side aggressive volume; negative delta means greater bid-side aggressive volume under that convention.
What is a footprint imbalance?
An imbalance occurs when one side’s measured volume substantially exceeds the compared opposite-side volume. TradingView uses a configurable diagonal comparison and documents a 300% default threshold.
What is a stacked imbalance?
A stacked imbalance is a sequence of multiple consecutive price rows showing imbalance in the same direction. It shows concentrated one-sided aggression but does not guarantee continuation.
What is absorption on a footprint chart?
Absorption is inferred when large aggressive volume trades into a level but price makes limited progress, suggesting that passive liquidity on the other side may be meeting the orders.
Are footprint charts better than Volume Profile?
No single tool is universally better. Futures Footprint Charts show bar-level transaction detail, while Volume Profile aggregates volume across prices over a broader selected range. They can be used together.
Can footprint charts predict reversals?
No. They can reveal conditions such as delta divergence, absorption, exhaustion and failed auctions, but none guarantees a reversal. Price structure and risk control remain necessary.
Do I need real-time futures data?
For live order-flow decisions, high-quality real-time exchange data is important. Delayed or heavily aggregated data can reduce the usefulness of footprint information.
Final Verdict: How to Use Futures Footprint Charts Correctly
Futures Footprint Charts are valuable because they expose information that a standard candlestick compresses away. Bid/ask activity, delta, imbalances, bar POC and transaction clusters can help a trader understand how a move was produced rather than simply observing the resulting candle.
The strongest process begins with a meaningful market location, then asks whether aggressive order flow confirms or contradicts the price response. Large numbers by themselves are not enough. An imbalance can fail, positive delta can be absorbed, and an unfinished auction can remain unfinished for longer than expected.
Use footprints as a precision layer on top of broader structure. Combine them with Volume Profile, Market Profile, open interest, contract specifications and disciplined risk management. That creates a more complete order-flow framework without pretending that any single footprint pattern can predict the future.
Explore NinjaTrader for futures order-flow analysis, simulation and Volumetric Bars
Affiliate Disclosure: TradeboticsAI may receive compensation when eligible users complete a qualifying action through certain affiliate links. Affiliate relationships do not determine our editorial conclusions.
Risk Disclosure: Futures trading involves substantial risk of loss and is not suitable for every investor. Footprint charts, delta, order-flow imbalance, absorption, exhaustion and historical transaction patterns do not predict future returns. Simulated trading and backtested results are hypothetical and do not guarantee future live performance. Nothing on this page is personalized investment, financial, tax or trading advice.