Futures VWAP 2026: Formula, Bands, Anchored VWAP & Trading Guide
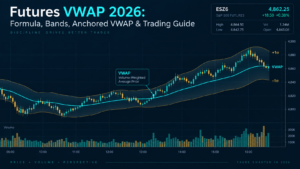
Futures VWAP gives intraday traders a volume-weighted reference price that answers a practical question: where has the contract traded on average when heavier transactions matter more than lighter ones? Unlike a simple moving average, VWAP incorporates both price and volume. That makes it useful for judging session location, comparing execution quality, framing mean-reversion or trend ideas, and adding context to ES, NQ, MES, MNQ, CL, GC and other liquid futures markets.
Quick Answer
Futures VWAP is the cumulative volume-weighted average price for a chosen calculation period. A simplified formula is VWAP = Σ(Price × Volume) ÷ ΣVolume. Session VWAP normally restarts with the configured trading session, while some platforms also support weekly, monthly or custom anchored calculations. Standard-deviation bands can frame how far price has moved from the weighted average. VWAP is a benchmark and context tool—not guaranteed support, resistance, fair value, or a standalone buy/sell signal.
Explore NinjaTrader for VWAP, futures charting and simulated trading
Affiliate Disclosure: TradeboticsAI may earn compensation when an eligible user completes a qualifying action through an affiliate link, at no additional cost to the user. Affiliate relationships do not determine our editorial conclusions.
What Is Futures VWAP?
Futures VWAP stands for Volume Weighted Average Price applied to a futures contract. The calculation weights prices by the amount of volume transacted, so prices associated with heavier trading influence the result more than prices associated with lighter activity.
NinjaTrader describes VWAP as the total value traded—price multiplied by transaction volume—divided by total traded volume for the selected period. CME Group also uses VWAP methodologies in real market benchmarks and fixing prices, which demonstrates that volume weighting is not merely a retail-chart concept.
VWAP is cumulative. Every new transaction or bar included in the calculation updates both the numerator and denominator. Early in a session, the line can react relatively quickly because little volume has accumulated. Later, a much larger body of volume can make the line slower to move.
This is why VWAP should not be described as an exact forecast of “fair value.” It is a historical weighted average of the trades included in the selected calculation window. The choice of session, reset interval, resolution and data feed all influence the result.
Official references:
NinjaTrader Order Flow VWAP documentation
and
CME Group fixing-price methodology.
Futures VWAP Formula: How the Calculation Works
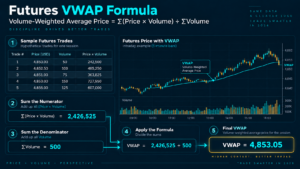
The simplified Futures VWAP formula is:
VWAP = Σ(Price × Volume) ÷ ΣVolume
Consider a simplified hypothetical sequence:
| Trade Price | Contracts | Price × Volume |
|---|---|---|
| 6,000.00 | 100 | 600,000 |
| 6,002.00 | 300 | 1,800,600 |
| 6,005.00 | 100 | 600,500 |
Total volume is 500 contracts and the sum of Price × Volume is 3,001,100. The resulting VWAP is 6,002.20. The 6,002.00 price has the greatest influence because three times as many contracts traded there as at either of the other example prices.
Real platforms can implement the calculation at different resolutions. NinjaTrader’s Order Flow VWAP supports a Standard resolution based on the selected input series and a Tick resolution that uses one-tick data. NinjaTrader describes Tick resolution as the more accurate and more resource-intensive choice.
That technical detail matters. Two traders can think they are comparing the same VWAP while using different resolutions or session templates, which can create slightly different lines and bands.
Futures VWAP Session Reset: RTH vs ETH
One of the most important configuration decisions is where the calculation starts. Futures VWAP is meaningless without knowing its reset point and trading-hours template.
For U.S. index futures, traders may compare a Regular Trading Hours profile with an Electronic Trading Hours profile. An RTH-based VWAP excludes overnight activity outside the selected cash-session template. An ETH-based VWAP incorporates the broader electronic session. These can produce different values because the underlying price and volume samples are different.
Neither is universally “correct.” A trader focused on the U.S. cash-session auction may prefer RTH. A trader whose strategy incorporates overnight inventory, European activity or premarket movement may prefer a broader session. The critical requirement is consistency.
| Configuration | Includes | Useful For | Potential Problem |
|---|---|---|---|
| RTH Session VWAP | Selected regular-hours session | Cash-session-focused intraday analysis | Ignores overnight volume |
| ETH Session VWAP | Broader electronic session | Overnight and full-session context | Can differ materially from cash-session reference |
| Weekly / Monthly VWAP | Multiple sessions until reset | Broader volume-weighted reference | Slower response as more data accumulates |
NinjaTrader supports Session, Week and Month reset intervals for its Order Flow VWAP. It also allows the trading-hours template to determine the session used by the calculation.
During quarterly index-futures rollover, verify the active contract before comparing levels. If liquidity has migrated from ESU26 to ESZ26, the new contract’s volume distribution becomes the relevant source for its own VWAP. Use our Futures Rollover Dates 2026 guide for rollover context.
Futures VWAP Standard-Deviation Bands Explained
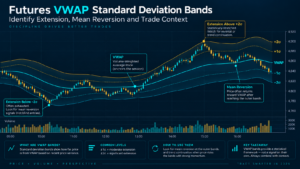
Many traders display standard-deviation bands around Futures VWAP. These bands quantify dispersion around the weighted reference rather than creating guaranteed reversal levels.
NinjaTrader’s Order Flow VWAP supports up to three standard-deviation bands. Its documented default multipliers are 1×, 2× and 3×. When volatility expands, the bands can widen; when the distribution is tighter, they can contract.
| Band | Typical Default | Possible Use | Do Not Assume |
|---|---|---|---|
| VWAP | Center line | Session weighted reference | Price must revert to it immediately |
| ±1σ | 1× | Nearer dispersion zone | Automatic support/resistance |
| ±2σ | 2× | More extended location | That every touch is mean-reversion |
| ±3σ | 3× | Extreme relative location | That a trend cannot continue beyond it |
The biggest mistake is fading every outer-band touch. On a strong trend day, price can remain above VWAP and repeatedly trade near an upper band while the center line rises behind it. On a balanced session, the same band may behave very differently.
Therefore, VWAP bands are best interpreted together with session structure, volume distribution and order flow rather than as fixed mathematical walls.
Session Futures VWAP vs Anchored VWAP
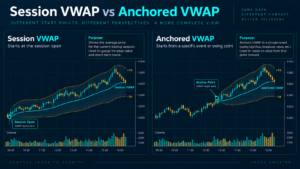
Session VWAP and anchored VWAP use the same volume-weighting principle but answer different questions because they begin accumulating from different points.
Session VWAP normally begins at the start of the configured trading session. Anchored VWAP begins at a deliberately chosen event or bar and continues from that anchor. Traders may anchor a calculation to a major swing high, swing low, news event, breakout, earnings-equivalent catalyst in related markets, or another objectively selected event.
A simplified anchored formula is identical in structure:
Anchored VWAP = Σ(Price × Volume) from Anchor ÷ ΣVolume from Anchor
| Type | Start Point | Best Question | Main Risk |
|---|---|---|---|
| Session VWAP | Session boundary | Where is the session’s weighted average? | Session choice changes the result |
| Anchored VWAP | Chosen event or bar | What is the weighted average since this event? | Hindsight bias in choosing the anchor |
Anchored VWAP can be useful across multiple sessions, but the anchor must have a defensible reason. If a trader repeatedly moves the anchor until the line appears to fit historical price, the analysis becomes curve fitting.
NinjaTrader’s 2026 VWAP education also describes a drawing tool that can calculate VWAP across a trader-selected bar range. Platform implementations differ, so confirm the exact tool and access available in your current software version.
Futures VWAP Price Interpretation Matrix
The relationship between price and Futures VWAP can organize intraday observations, but it should not be converted into an automatic rule such as “above VWAP equals buy.”
| Price Behavior | VWAP Behavior | Possible Context | What to Verify |
|---|---|---|---|
| Above VWAP | Rising | Session trading above a rising weighted average | Trend structure, volume and pullback quality |
| Below VWAP | Falling | Session trading below a falling weighted average | Support, selling pressure and continuation |
| Repeated crosses | Flat | Possible rotational / balanced conditions | Volume Profile, range boundaries and chop risk |
| Far above | Strongly rising | Directional extension | Do not assume overbought means reversal |
| Returns to VWAP | Stable / sloping | Test of the session weighted reference | Order-flow response and acceptance/rejection |
The same price/VWAP relationship can produce different outcomes on trend, balance and news-driven sessions. This is why VWAP should define context rather than replace the decision process.
Futures VWAP vs Moving Average vs Volume Profile
VWAP, moving averages and Volume Profile can appear to answer similar questions, but their calculations and use cases differ.
| Tool | Core Input | Primary Output | Best Question |
|---|---|---|---|
| VWAP | Price + volume across a cumulative period | One evolving weighted-average line + optional bands | Where is the volume-weighted average since reset? |
| Moving Average | Usually price across a rolling number of bars | Rolling average line | What is the recent price trend average? |
| Volume Profile | Volume distributed by price | Horizontal distribution, POC, VAH, VAL | At which prices did the most volume trade? |
VWAP compresses the selected period into a continuously updating weighted average. Volume Profile preserves the distribution across multiple prices. A session can therefore have one VWAP value at a moment in time while also containing several high- and low-volume nodes.
Use our Futures Volume Profile 2026 guide for POC, VAH, VAL and node analysis. For time-at-price rather than volume-at-price, see Futures Market Profile 2026.
Practical Futures VWAP Example: ES Trend vs Mean Reversion
Consider a hypothetical ES regular-hours session. The market opens at 6,010.00. After the first hour, Futures VWAP is 6,015.50, the +1 standard-deviation band is 6,023.00 and the -1 band is 6,008.00.
Scenario A: Trend Acceptance Above VWAP
ES trades above VWAP for most of the first hour. Pullbacks repeatedly stop around 6,016–6,018 while VWAP itself continues rising. Cumulative Delta is broadly positive and footprint pullbacks show selling that fails to push price below the weighted average.
The useful observation is not simply “price is above VWAP.” The stronger context is that price remains above a rising benchmark and attempts to trade below it are rejected. A trader could use that information as one layer in a trend-continuation plan with a separately defined invalidation.
Scenario B: Extension With Failed Follow-Through
Later, ES spikes to 6,031.00, beyond the upper band. Instead of continuing higher, Time & Sales shows aggressive buying that produces little additional progress, and price quickly returns below 6,027.00.
That does not mean the upper band “caused” a reversal. It means an extended location combined with weak price response gives a different setup from Scenario A. The band provided location; order flow supplied evidence about the actual response.
This is the practical role of VWAP: a reference around which traders can organize other evidence.
For the order-flow layers in this example, see Futures Cumulative Delta 2026, Futures Footprint Charts 2026 and Futures Time and Sales 2026.
A Practical Futures VWAP Trading Workflow
Use this process to keep Futures VWAP analysis consistent:
- Confirm the active contract. Make sure liquidity has not migrated to the next expiration.
- Choose the session intentionally. Decide whether RTH, ETH or another documented template matches the strategy.
- Confirm the reset interval. Session, weekly, monthly and anchored calculations answer different questions.
- Check the slope. A rising, falling or flat line adds information beyond price merely being above or below it.
- Identify band location. Note whether price is near VWAP, ±1σ, ±2σ or another configured band.
- Classify the session. Ask whether the market is trending, balancing or reacting to a major event.
- Compare with volume structure. POC, VAH, VAL and HVN/LVN can show whether the weighted average overlaps important transaction zones.
- Add order-flow confirmation. Footprint, CVD and Time & Sales can show whether aggressive trading is producing progress.
- Define risk independently. VWAP does not determine account size, maximum loss or stop placement by itself.
- Record the setup. Save the session template, reset choice, band settings and screenshots so the process can be reviewed objectively.
Explore NinjaTrader for VWAP, Order Flow tools and futures simulation

Using Futures VWAP in NinjaTrader
NinjaTrader’s Order Flow VWAP provides several settings that materially affect the chart. According to its official documentation, traders can choose Session, Week or Month reset intervals; Standard or Tick resolution; a trading-hours template for session calculations; and up to three standard-deviation bands with configurable multipliers.
Default standard-deviation multipliers are documented as 1×, 2× and 3×. NinjaTrader also notes that Tick resolution is more accurate but more resource intensive, while Standard resolution runs from the selected input series.
This means a screenshot labeled “VWAP” is incomplete without its settings. For reproducible VWAP analysis, record:
- contract symbol and expiration;
- trading-hours template;
- reset interval;
- resolution;
- standard-deviation multipliers;
- whether the chart includes overnight data;
- whether the calculation is session-based or manually anchored.
Feature access and pricing can change over time. Verify current Order Flow+ availability directly with NinjaTrader before choosing a plan specifically for VWAP or other order-flow features.
When Futures VWAP Is Less Useful
Futures VWAP is popular precisely because it is simple, which also makes it easy to misuse. Several market conditions deserve caution.
Early Session
Very little volume has accumulated shortly after the reset, so the line and bands can move rapidly. The early value may be less stable than the same calculation later in the session.
Strong Trend Days
Mean-reversion assumptions can fail badly when the market accepts prices persistently away from VWAP. Price can remain above or below the reference for hours.
Major News Releases
Rapid repricing can make historical weighted averages temporarily less relevant as the market reacts to genuinely new information.
Thin or Inactive Contracts
A volume-weighted calculation becomes less informative when the underlying contract has poor liquidity or when trading has migrated to another expiration.
Wrong Session Template
An RTH line and an ETH line are answering different questions. Comparing them without knowing the underlying session can create false conclusions.
Anchor Hindsight
Anchored VWAP becomes vulnerable to curve fitting when traders select the anchor only because the historical line looks attractive.
These limitations do not make the indicator useless. They define when a VWAP reading requires more context.
Pros and Limitations of Futures VWAP
Pros
- Weights price by actual traded volume.
- Creates a clear intraday reference line.
- Can be paired with standard-deviation bands.
- Useful for trend, mean-reversion and execution context.
- Combines naturally with Volume Profile and order flow.
- Session, weekly, monthly and anchored variants answer different questions.
Limitations
- Results depend on session and reset configuration.
- It is cumulative and can lag as volume builds.
- Outer bands do not guarantee reversals.
- Price can remain extended during strong trends.
- Different resolutions can produce different calculations.
- It does not replace market structure or risk management.
Who Is Futures VWAP Best For?
VWAP is most useful for intraday traders who need an objective volume-weighted reference and are willing to define their session settings consistently. It can be especially relevant for liquid index, energy, metals and other futures contracts where centralized exchange volume provides a meaningful data source.
It is less suitable as a standalone signal for traders who simply want an automatic long-above/short-below rule. The line becomes far more useful when the trader understands contract rollover, session structure, volume distribution, current volatility and risk per tick.
For platform research, see our Best Futures Trading Platforms 2026 guide. For tick size and contract value, see Futures Contract Specifications 2026.
Futures VWAP FAQ
What is Futures VWAP?
Futures VWAP is the cumulative volume-weighted average price of a futures contract over a selected calculation period. Prices associated with greater traded volume have more influence on the result.
What is the VWAP formula?
A simplified formula is Σ(Price × Volume) ÷ ΣVolume. Platforms may calculate this from tick-level transaction data or from a selected input series depending on the software and resolution settings.
Does VWAP reset every day?
Session VWAP resets according to the configured session boundary. NinjaTrader also supports weekly and monthly reset intervals, while anchored VWAP starts from a trader-selected point.
Should futures traders use RTH or ETH VWAP?
There is no universal answer. RTH focuses on the selected regular trading session, while ETH incorporates broader electronic-session data. Use the template that matches the strategy and keep it consistent.
What do VWAP standard-deviation bands mean?
They measure dispersion around the weighted average. NinjaTrader documents default multipliers of 1×, 2× and 3× for its three optional band levels. They provide relative location, not guaranteed reversal zones.
Is price above VWAP bullish?
It can describe an intraday condition in which price is trading above the selected weighted average, especially if VWAP is rising. It does not guarantee that price will continue higher.
Is VWAP support or resistance?
Traders often monitor reactions around VWAP and its bands, but the line is not guaranteed support or resistance. A better approach is to observe whether the market accepts, rejects or repeatedly crosses the area.
What is anchored VWAP?
Anchored VWAP begins the volume-weighted calculation at a chosen event or bar rather than at a standard session boundary. The value of the analysis depends heavily on choosing a defensible anchor rather than fitting it retrospectively.
What is the difference between VWAP and Volume Profile?
VWAP compresses the selected period into an evolving weighted-average line. Volume Profile shows the distribution of volume across price levels and identifies structures such as POC, VAH, VAL, HVNs and LVNs.
Does NinjaTrader have VWAP?
Yes. NinjaTrader documents Order Flow VWAP with configurable reset intervals, resolution, trading-hours settings and up to three standard-deviation bands. Verify current product access and pricing directly with NinjaTrader.
Final Verdict: How to Use Futures VWAP Correctly
Futures VWAP is valuable because it transforms a session’s price and volume into a simple evolving benchmark. Its strength is not that it predicts the market. Its strength is that it gives traders a consistent reference for asking better questions about location, trend, extension, mean reversion and execution quality.
The most important details are configuration and context. Know which contract you are trading, where the calculation resets, whether it uses RTH or ETH data, which resolution is selected and how the bands are configured. Then compare price behavior with Volume Profile, CVD, footprint data and actual transaction flow.
A rising VWAP with sustained acceptance above it tells a different story from a flat VWAP that price crosses repeatedly. An outer-band touch on a trend day tells a different story from the same touch inside a balanced session. The indicator becomes useful when those differences are measured rather than assumed.
Use VWAP as a structured reference—not as a promise of support, resistance or future returns.
Explore NinjaTrader for VWAP, Order Flow analysis and futures simulation
Affiliate Disclosure: TradeboticsAI may receive compensation when eligible users complete a qualifying action through certain affiliate links. Affiliate relationships do not determine our editorial conclusions.
Risk Disclosure: Futures trading involves substantial risk of loss and is not suitable for every investor. VWAP, standard-deviation bands, anchored VWAP, volume analysis and historical market relationships do not predict future returns. Simulated and backtested results are hypothetical and do not guarantee future live performance. Nothing on this page is personalized investment, financial, tax or trading advice.