Futures DOM Trading 2026: Depth of Market, Order Book & Scalping Guide
Futures DOM Trading uses the Depth of Market ladder to examine visible bids, offers, order-book depth and live execution around specific price levels. Instead of relying only on candles, a DOM trader can watch resting liquidity change as orders are added, reduced, canceled or executed. The tool can be especially useful for active ES, NQ, MES, MNQ, CL, GC and Treasury futures traders, but displayed size is not the same thing as guaranteed liquidity or trader intent.
Quick Answer
Futures DOM Trading uses a vertical price ladder to display bids and offers around the current market. Traders can monitor spread, displayed size, order-book changes, recent executions and their own order position while placing or managing trades directly from the ladder. DOM data can help evaluate short-term liquidity and execution, but visible orders can change or disappear and market depth alone does not fully measure liquidity. Use the DOM together with actual trades, price response and disciplined risk controls.
Explore NinjaTrader for SuperDOM, futures simulation and order-flow tools
Affiliate Disclosure: TradeboticsAI may earn compensation when an eligible user completes a qualifying action through an affiliate link, at no additional cost to the user. Affiliate relationships do not determine our editorial conclusions.
What Is Futures DOM Trading?
Futures DOM Trading is the use of a Depth of Market interface—often called DOM, Level II, price ladder or order book—to analyze and execute futures orders. The combined bid and ask information around the market represents currently displayed liquidity at multiple price levels.
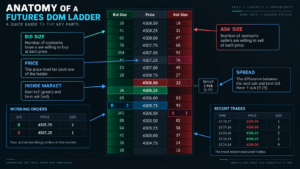
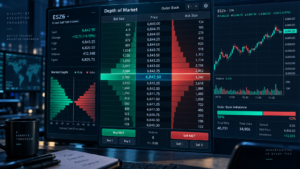
A typical ladder centers the current market price vertically. Buy orders appear below or around the best bid, sell orders appear above or around the best offer, and the inside market is defined by the highest bid and lowest ask. Depending on the platform, traders can also see recent trade volume, their working orders, position information and execution controls directly inside the DOM.
The most important distinction is that DOM quantities generally represent resting orders, not completed trades. A limit order displayed in the book can trade, remain in the queue, be modified or be canceled. By contrast, Time & Sales records transactions that have already executed.
This difference is why Futures DOM Trading is often paired with tape reading. The DOM answers “what liquidity is currently displayed?” while Time & Sales answers “what actually traded?”
For official exchange information on futures market structure and market data, see
CME Group.
Futures DOM Trading: Anatomy of a Price Ladder
DOM layouts differ between platforms, but the core information used in Futures DOM Trading is usually similar.
| DOM Element | What It Represents | Practical Question | Important Limitation |
|---|---|---|---|
| Price Ladder | Tradable price levels | Where can orders be placed? | Price alone says nothing about liquidity quality |
| Bid Size | Displayed buy quantity resting at a price | How much visible demand is queued? | Orders can be canceled before execution |
| Ask Size | Displayed sell quantity resting at a price | How much visible supply is queued? | Displayed quantity does not prove seller intent |
| Inside Market | Best bid and best ask | What is the current spread? | Spread can change rapidly |
| Working Orders | Trader’s active orders | Where am I entering, exiting or protecting risk? | Fill priority depends on queue and matching rules |
| Recent Volume | Executed contracts shown by the platform | Where is actual business occurring? | Display methodology varies by platform |
A DOM becomes useful when these elements are interpreted together. A large bid means little if it disappears before sellers reach it. A smaller bid that repeatedly replenishes while heavy selling executes can provide a very different form of information.
How the Futures Order Book Works
Understanding the central limit order book is essential for Futures DOM Trading. Limit orders provide displayed liquidity by resting at specific prices. Marketable orders consume available liquidity by executing against those resting orders.
Suppose ES shows:
- 6,500.00 bid: 240 contracts
- 6,500.25 ask: 175 contracts
- 6,500.50 ask: 310 contracts
If aggressive buyers purchase all 175 contracts displayed at 6,500.25 and additional buying continues, executions may begin occurring at 6,500.50. If new sell orders appear at 6,500.25 as contracts trade, the offer can replenish rather than disappear.
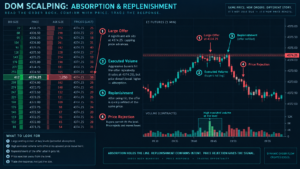
This replenishment is one reason experienced Futures DOM Trading practitioners focus on behavior rather than one static snapshot. A large resting order can vanish. A seemingly small level can absorb far more volume than was initially displayed if liquidity repeatedly refreshes.
Price-Time Priority and Queue Position
At the same price, matching priority commonly depends on exchange rules and order priority. For a trader joining a large bid queue, being behind hundreds of contracts can affect the probability and timing of a fill.
If your limit buy order is resting at 6,500.00 behind substantial quantity, seeing transactions occur at that price does not automatically mean your order will fill immediately. Earlier orders can receive execution first under the applicable matching algorithm.
Queue dynamics are especially important for short-term scalpers because a one-tick theoretical edge can disappear if entries or exits consistently receive poor queue position.
Futures DOM Trading: Market by Order vs Market by Price
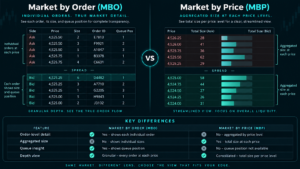
Not every market-depth feed contains the same level of information. CME Group distinguishes between Market by Order (MBO) and Market by Price (MBP).
MBO can provide order-level information such as individual order size, full depth and queue-position visibility. MBP consolidates quantity at each price level rather than exposing every individual order. CME documents MBP updates with a maximum of ten price levels in that format.
| Feature | Market by Price | Market by Order |
|---|---|---|
| View | Aggregated quantity by price | Individual order-level information |
| Queue Insight | Limited | More detailed queue-position information |
| Order Sizes | Consolidated | Individual orders can be represented |
| Depth | Price-level depth | Full order-level depth where supported |
The exchange feed and the information a retail platform actually displays are not always identical. A trader should verify the connected data provider, subscription and platform implementation before assuming a ladder exposes every detail available from the exchange.
This is a meaningful information-gain point for Futures DOM Trading: two ladders displaying the same ES price can still offer different depth information because the underlying data package or visualization method differs.
How to Read Futures DOM Trading Activity
The most common mistake in Futures DOM Trading is assuming that the largest visible number must behave as support or resistance. The DOM is dynamic. What matters is how liquidity behaves as price approaches and trades through a level.
1. Watch Liquidity Addition and Removal
Displayed size can increase as participants add resting orders and decrease because orders trade or are canceled. A sudden increase in bid size may appear supportive, but that interpretation becomes weak if the quantity repeatedly disappears as price approaches.
2. Compare Displayed Size With Executed Volume
If 200 contracts are initially visible at the bid but 900 contracts trade there without price moving lower, liquidity may be replenishing. That behavior can be more informative than the original 200-contract snapshot.
3. Watch the Inside Market
The relationship between best bid, best ask and recent executions can reveal short-term pressure. Repeated trading at the ask accompanied by higher prices differs from repeated ask execution that fails to lift the market.
4. Observe Order-Book Response After a Break
After price trades through an important level, ask whether depth migrates with price or rapidly rebuilds behind the move. A breakout that gains new bids beneath price has different short-term structure from a breakout where the ladder immediately collapses back into the previous range.
5. Treat Pulling and Stacking Carefully
Traders often use “stacking” to describe additional visible size appearing and “pulling” to describe visible size being removed. These changes can provide context, but they do not prove whether an order was genuine directional interest, risk management, liquidity provision or another strategy.
Futures DOM Trading should therefore focus on repeated behavior plus actual executions rather than attempting to read minds from one displayed quantity.
Does DOM Depth Measure Real Futures Liquidity?
DOM depth is useful, but Futures DOM Trading becomes dangerous when displayed book depth is treated as the complete definition of liquidity.
CME Group research has specifically cautioned against evaluating liquidity from order-book depth alone. During high-volatility periods, displayed depth can decline sharply even while trading volume remains extremely high and markets continue processing substantial transactions.
A better liquidity framework includes:
- bid/ask spread;
- displayed depth;
- actual traded volume;
- price impact;
- slippage;
- frequency of replenishment;
- order size relative to available depth;
- time of day;
- volatility and scheduled events.
CME’s Liquidity Tool similarly evaluates dimensions such as bid-offer spread, book depth and cost to trade. This reinforces an important principle: a large number displayed on the ladder is only one piece of the execution-quality puzzle.
For contract tick size and dollar exposure, see Futures Contract Specifications 2026.
Practical Futures DOM Trading Example: ES Scalping
Consider a hypothetical ES session. Prior-session VAH is 6,620.00 and the market is trading just below it. The trader uses the level as context and then watches the ladder rather than entering solely because price reached resistance.
The inside market shows:
- 6,619.75 bid: 185 contracts
- 6,620.00 ask: 420 contracts
- 6,620.25 ask: 235 contracts
At first glance, the 420-contract offer may look like resistance. But the next sequence matters more.
Aggressive buyers execute repeatedly at 6,620.00. Approximately 700 contracts trade there, yet visible size continues replenishing and price cannot trade sustainably above 6,620.25. Time & Sales shows continued ask-side execution but little upward progress.
The working hypothesis is now possible absorption, not “420 contracts means short.” If price then falls back through 6,619.50 and selling begins hitting bids, the rejection hypothesis has additional evidence.
Now reverse the scenario. Buyers consume the 6,620.00 offer, price immediately trades 6,620.25 and 6,620.50, new bids stack beneath the market, and transactions continue above the former resistance. The same starting DOM snapshot has produced a completely different outcome.
This example illustrates the core principle of Futures DOM Trading: displayed size + executed volume + price response is far more useful than displayed size alone.
For the executed-trade layer, see Futures Time and Sales 2026.
Futures DOM Trading vs Time & Sales, Footprint and CVD
Order-flow tools overlap, but each answers a different question.
| Tool | Primary Information | Best Question | Main Limitation |
|---|---|---|---|
| DOM | Resting bids/offers and ladder execution | Where is visible liquidity right now? | Orders can change or cancel |
| Time & Sales | Completed transactions | What actually traded? | Raw tape can move extremely fast |
| Footprint | Executed volume inside bars by price | Where did bid/ask aggression occur? | Aggregated historical representation |
| CVD | Accumulated delta | Is aggressive pressure building or diverging? | Calculation method affects values |
A practical Futures DOM Trading setup can therefore start with visible liquidity, use Time & Sales to verify actual transactions, footprint charts to review price-level execution and CVD to evaluate broader aggressive pressure.
Read our Futures Footprint Charts 2026 and Futures Cumulative Delta 2026 guides for those complementary layers.
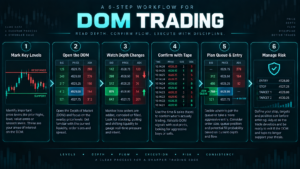
A Practical Futures DOM Trading Workflow
A repeatable Futures DOM Trading process should begin before the trader starts clicking the ladder:
- Confirm the active contract. During rollover, trade the expiration carrying the relevant volume and liquidity.
- Mark important prices first. Prior highs/lows, VWAP, VAH, VAL, POC and Initial Balance give the DOM a reason for observation.
- Check the spread. Know the current inside market before placing any order.
- Observe normal depth. Establish what typical visible size looks like for the instrument and time of day.
- Watch depth changes. Note whether orders are added, removed or repeatedly replenished as price approaches.
- Confirm with executions. Use Time & Sales or footprint information to see whether resting liquidity actually trades.
- Compare execution with price response. Heavy buying that fails to lift price can mean something very different from buying that quickly advances the market.
- Plan queue-aware entries. Recognize that a limit order can sit behind existing contracts at the same price.
- Define risk before entry. Stops and maximum loss must be decided before fast ladder movement creates emotional decisions.
- Practice in simulation. Ladder execution is fast; simulated trading can help build platform familiarity without live financial exposure.
Explore NinjaTrader SuperDOM and practice futures execution in simulation
Futures DOM Trading With NinjaTrader SuperDOM
NinjaTrader’s ladder is called SuperDOM. NinjaTrader describes DOM as “depth of market,” also known as Level II or the order book, and positions SuperDOM as both a market-depth display and an order-entry interface.
For active Futures DOM Trading, the practical benefit of a ladder-based interface is speed. A trader can monitor prices, visible bids and offers while managing entries, stops and targets from the same workspace rather than switching continually between separate windows.
Depending on platform configuration, data connection and account setup, ladder traders may use functions such as:
- limit order entry;
- market order execution;
- working-order modification;
- stop and target management;
- ATM strategy templates;
- position display;
- bid/ask depth visualization;
- order-flow and market-depth tools.
Do not confuse platform functionality with trading edge. Faster clicking cannot compensate for poor risk management or an incorrect interpretation of order-book behavior.
For platforms specifically designed around ladders, see our Best DOM Trading Platforms 2026 comparison.
Explore NinjaTrader for SuperDOM, advanced charts and futures order execution
Market Data Requirements for Futures DOM Trading
High-quality Futures DOM Trading depends on the data being displayed. A trader should know whether the connection includes real-time quotes, top-of-book data, multiple depth levels or more detailed order-level information.
CME Group’s real-time data offerings distinguish trades, top of book, market depth and other market statistics. Those are different datasets and can provide different levels of visibility.
Before comparing two DOM platforms, verify:
- exchange subscription;
- real-time vs delayed data;
- number of displayed depth levels;
- Market by Price vs Market by Order availability;
- queue information;
- historical market-depth availability;
- refresh and aggregation method;
- order-routing connection;
- session and contract being displayed.
If two traders use different depth subscriptions, their ladders can display materially different information even if both are trading the same futures symbol.
Common Futures DOM Trading Mistakes
1. Treating a Large Order as Guaranteed Support or Resistance
Visible orders can be canceled. Watch whether the quantity remains, trades or replenishes when price actually reaches the level.
2. Assuming Book Depth Equals Total Liquidity
CME research shows that displayed depth alone can provide an incomplete picture. Spread, price impact, traded volume and replenishment also matter.
3. Ignoring Queue Position
A limit order can sit behind substantial existing quantity at the same price. Touching your limit price does not guarantee an immediate fill.
4. Confusing Resting Orders With Executed Trades
The DOM primarily displays visible order-book liquidity. Time & Sales shows completed transactions. Futures DOM Trading becomes stronger when both are monitored together.
5. Watching Every Price Without Context
A ladder contains constant movement. Start with an important market location so order-book behavior answers a specific question.
6. Trading During Rollover on the Wrong Contract
Liquidity can migrate rapidly between expirations. Check our Futures Rollover Dates 2026 guide before relying on a thin ladder.
7. Clicking Too Quickly
DOM execution makes orders easy to place, but speed can increase operational mistakes. Confirm quantity, order type and risk before sending an order.
8. Treating Simulation as Proof of Live Results
Simulation is useful for learning a ladder and practicing execution, but hypothetical fills and decision-making do not reproduce every aspect of live trading.
Pros and Limitations of Futures DOM Trading
Pros
- Shows visible bids and offers around current price.
- Useful for short-term liquidity analysis.
- Allows fast ladder-based order entry.
- Can reveal replenishment and book changes.
- Helps traders consider queue position.
- Pairs naturally with Time & Sales and footprint charts.
Limitations
- Displayed orders can be changed or canceled.
- Depth alone does not fully define liquidity.
- Fast markets can make the ladder difficult to read.
- Feed and platform methodology can differ.
- Visible size does not reveal participant intent.
- Very short-term focus can encourage overtrading.
Who Is Futures DOM Trading Best For?
Futures DOM Trading is most relevant for short-term futures traders who care about execution, visible liquidity and price-level behavior. It can be particularly useful for scalpers and active day traders in liquid contracts where spreads are tight and the order book updates frequently.
It is less useful for traders whose holding period is measured in days or weeks and who do not need second-by-second order-book information. It is also not a substitute for understanding contract value, volatility and position risk.
Beginners should first understand futures mechanics, tick values and order types before attempting to make decisions from a rapidly changing ladder.
Futures DOM Trading FAQ
What is Futures DOM Trading?
Futures DOM Trading is the analysis and execution of futures through a Depth of Market ladder that displays prices, visible bid and ask quantities and, depending on the platform, working orders and execution information.
What does DOM mean in futures?
DOM means Depth of Market. It refers to order-book depth around the current price and is also commonly associated with Level II market data.
What is the difference between bid size and ask size?
Bid size represents displayed buy quantity resting at a price, while ask size represents displayed sell quantity. Both can change, execute or be canceled.
Is a large bid bullish?
Not automatically. A large bid is visible liquidity at one moment. It can remain, replenish, execute or disappear. The actual response when price reaches the level is more informative than its initial size.
What is queue position?
Queue position describes an order’s place relative to other orders at the same price. Earlier orders may receive fills first depending on the exchange’s matching methodology.
What is Market by Order?
Market by Order is a more granular exchange data format that can show individual orders, full depth and queue-position information. Market by Price aggregates quantity at each price level.
Is DOM the same as Time and Sales?
No. DOM primarily shows resting order-book liquidity. Time & Sales records transactions that have already executed.
Can DOM predict market direction?
No. Futures DOM Trading can provide short-term liquidity and execution context, but visible depth cannot guarantee future price direction.
Is DOM useful for scalping?
It can be useful because scalpers care about spread, queue position, short-term liquidity and immediate execution. However, the ladder should be combined with market location and strict risk management.
Does NinjaTrader have a DOM?
Yes. NinjaTrader calls its ladder interface SuperDOM and describes it as a depth-of-market and order-entry tool for futures traders.
Does more DOM depth mean more liquidity?
Not necessarily. Displayed depth is one liquidity metric. Actual traded volume, spread, price impact, replenishment and execution cost also matter.
Final Verdict: How to Use Futures DOM Trading Correctly
Futures DOM Trading is most valuable when it is treated as a live execution and liquidity framework rather than a predictor. The ladder reveals where bids and offers are currently displayed, but the important information emerges from how those orders behave when the market reaches them.
A 500-contract offer that disappears before price arrives is different from a 150-contract offer that repeatedly replenishes while 1,000 contracts trade into it. A large bid that looks supportive is less meaningful if the market trades through it immediately. Visible depth must therefore be compared with actual transactions and price response.
The strongest process combines Futures DOM Trading with Time & Sales, footprint charts, Cumulative Delta and broader market structure. That gives the trader separate views of resting liquidity, executed volume, aggression and price behavior.
Use the DOM to improve observation and execution—not to assume that every large displayed order reveals where price must go next.
Explore NinjaTrader for SuperDOM, order-flow analysis and futures simulation
Affiliate Disclosure: TradeboticsAI may receive compensation when eligible users complete a qualifying action through certain affiliate links. Affiliate relationships do not determine our editorial conclusions.
Risk Disclosure: Futures trading involves substantial risk of loss and is not suitable for every investor. DOM depth, visible liquidity, queue information, order-book changes and historical order-flow behavior do not predict future returns. Displayed orders may be modified or canceled. Simulated results are hypothetical and do not guarantee future live performance. Nothing on this page is personalized investment, financial, tax or trading advice.