Futures Auction Market Theory 2026: Balance, Value, TPO & Trading Guide
Futures Auction Market Theory is a framework for understanding futures markets as a continuous two-way auction in which price moves to find participation, pauses where trade is accepted, and moves again when that balance breaks. Instead of asking only whether a candle is bullish or bearish, the framework asks whether the market is accepting price, rejecting price, building value or searching for a new value area. Market Profile, TPO, Volume Profile, VWAP and order-flow tools can all help visualize different parts of that auction, but none of them replaces the core task: identifying whether the market is balanced or imbalanced and whether current prices are being accepted.
Quick Answer
Futures Auction Market Theory views the market as a continuous auction searching for prices where buyers and sellers are willing to transact. When trade repeatedly develops around a price range, the market is showing acceptance and balance. When price leaves that area and finds little opposing activity, the market is in price discovery or imbalance. TPO Market Profile can organize time at price, Volume Profile can organize traded volume at price, and order flow can show the transactions driving the move. The framework is descriptive, not predictive: acceptance and rejection must be confirmed by actual market behavior.
Explore NinjaTrader for TPO, Volume Profile, Order Flow and futures simulation
Affiliate Disclosure: TradeboticsAI may earn compensation when an eligible user completes a qualifying action through an affiliate link, at no additional cost to the user. Affiliate relationships do not determine our editorial conclusions.
What Is Futures Auction Market Theory?
Futures Auction Market Theory is a market-structure framework that treats price as the mechanism used to facilitate trade between buyers and sellers. Markets continually test prices in both directions. When a price area attracts sustained participation, the auction is showing acceptance. When activity quickly leaves a price area and cannot build business there, the auction is showing rejection.
CME Group’s glossary describes Market Profile as an analytical tool that organizes price and time information to identify areas where price is being accepted and rejected. NinjaTrader likewise describes Market Profile through Time Price Opportunity, or TPO, where traders can examine how long the market is willing to trade at different prices.
The framework is therefore broader than a chart type. Market Profile is one visualization of auction behavior, not the entire theory. Futures Auction Market Theory can also be studied with Volume Profile, VWAP, footprint charts, DOM data and Time & Sales because each tool answers a different question about the same auction.
Official references:
CME Group Glossary
and
NinjaTrader Market Profile Guide.
How the Futures Auction Process Works
At the simplest level, a futures market needs buyers and sellers to agree on a price for a transaction to occur. Limit orders rest in the order book, while marketable orders cross the spread and execute against available liquidity. Price changes when the market needs to search for additional counterparties.
Imagine ES trading around 6,500.00. If buyers and sellers repeatedly transact between 6,498.00 and 6,502.00, volume and time begin concentrating in that range. The market is showing acceptance. If aggressive buyers then consume available offers and ES quickly trades toward 6,510.00 without returning to the prior range, the auction has shifted from balance toward price discovery.
The process can be summarized as:
- Search: price moves to test for participation.
- Response: buyers and sellers either transact or withdraw.
- Acceptance: sustained activity develops around a price area.
- Balance: trade rotates around an established value zone.
- Imbalance: one side becomes more aggressive or the opposing side withdraws.
- New search: price moves to find another area where two-sided trade can develop.
Futures Auction Market Theory does not claim that every move follows a perfectly clean sequence. News, thin liquidity and fast markets can produce abrupt repricing. The model is useful because it gives traders a consistent language for describing whether the market is facilitating trade or rejecting current prices.

Futures Auction Market Theory: Balance vs Imbalance
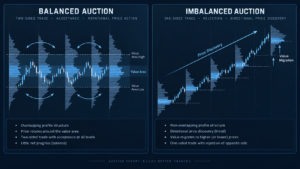
Balance and imbalance are the two most important states in Futures Auction Market Theory. A balanced market is facilitating two-sided trade around a relatively accepted price region. An imbalanced market is moving directionally because the previous area is no longer attracting enough opposing activity to contain the move.
| Condition | Typical Behavior | Useful References | Main Risk |
|---|---|---|---|
| Balance | Rotation around value, repeated overlap, two-way trade | POC, VAH, VAL, VWAP, profile center | Chasing breakouts that fail back into value |
| Imbalance | Directional price discovery, less overlap, value migration | Prior value edge, developing POC, breakout structure | Fading a trend simply because price looks extended |
In balance, traders often focus on whether excursions outside value are rejected back toward the middle. In imbalance, the stronger question is whether new prices are being accepted. If value, volume and time begin migrating higher after a breakout, the auction is doing more than briefly probing above resistance.
This distinction helps prevent a common mistake: using the same strategy in every environment. Mean-reversion tactics usually fit balanced conditions better than strong directional discovery, while breakout continuation requires evidence that the market is building new acceptance rather than immediately returning to the old range.
Acceptance and Rejection in Futures Auction Market Theory
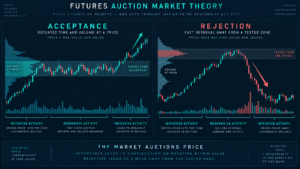
Acceptance and rejection describe how the market responds after price reaches a new area. These concepts are central to Futures Auction Market Theory because price movement alone does not tell the full story.
Acceptance
Acceptance means the market spends meaningful time or volume around a price area instead of immediately leaving it. Signs can include repeated TPO prints, increasing volume, a developing POC, overlapping bars, or successful retests after a breakout.
Rejection
Rejection means the market tests a price but fails to build sustained business there. On a profile, rejection can appear as a thin tail or low-volume region. On a footprint, it may appear as a failed aggressive push followed by opposite-side response. On a standard chart, it may show as a rapid return inside the prior range.
A useful rule is that acceptance is demonstrated by continued trade, while rejection is demonstrated by failure to remain. A single wick is not enough by itself. The market should show what happens after the test.
TPO and Market Profile in Futures Auction Market Theory
Time Price Opportunity is one of the classic ways to visualize the auction. NinjaTrader explains that each TPO combines time, price and volume context, with letters or blocks representing periods during which the market traded at a given price.
A TPO profile can help identify:
- prices where the market spent substantial time;
- prices quickly rejected by the auction;
- the profile’s Point of Control;
- Value Area High and Value Area Low;
- Initial Balance;
- single prints and directional extensions;
- developing balance and profile shape.
CME’s glossary specifically notes that Market Profile organizes price and time to reveal developing trends and areas of acceptance or rejection. That makes TPO a natural visualization for Futures Auction Market Theory.
However, time at price and traded volume are not identical. A market can spend a long time at a price with moderate volume, or trade enormous volume quickly during a high-activity event. That is why TPO and Volume Profile should not be treated as interchangeable.
For a dedicated TPO guide, see Futures Market Profile 2026.
Market Profile vs Volume Profile in Futures Auction Market Theory
Both tools describe where the auction conducted business, but they measure different things.
| Tool | Primary Input | Core Question | Typical Output |
|---|---|---|---|
| TPO Market Profile | Time at price | Where was the market willing to spend time? | TPO distribution, TPOC, value area, Initial Balance |
| Volume Profile | Contracts traded at price | Where did the most actual volume trade? | VPOC, VAH, VAL, HVN, LVN |
NinjaTrader describes Volume Profile’s POC as the price where the most volume traded and its value area as roughly 70% of session volume under the common default methodology. TPO value areas are derived from time-based distribution instead. The levels can overlap, but they are not guaranteed to match.
For Futures Auction Market Theory, disagreement between the two can be informative. A price can attract substantial time but relatively less volume, or attract intense volume in a short period. That difference can help distinguish slow balance from a high-intensity battle around a level.
See Futures Volume Profile 2026 for POC, VAH, VAL, HVN and LVN analysis.
Initial Balance and Opening Structure
The Initial Balance is the early-session price range used in classic Market Profile analysis. Many practitioners define it using the first hour of the regular session, although platforms and methodologies can allow custom periods. The important requirement is consistency: a trader should know exactly which session and time window created the range.
Within Futures Auction Market Theory, the Initial Balance helps frame whether the market is rotating inside early value or expanding beyond it. An Initial Balance breakout is not automatically bullish or bearish. The key question is whether the market accepts the extension.
Consider three possibilities:
- Break and accept: price leaves the Initial Balance, volume develops outside it and value migrates in the same direction.
- Break and reject: price briefly trades outside the range but quickly returns inside.
- Two-sided extension: price extends both above and below the Initial Balance, indicating a broader auction rather than clean directional control.
This is more informative than treating the Initial Balance high and low as static support and resistance lines.
Initiative vs Responsive Activity
Auction-based traders often describe activity as initiative or responsive. These terms are useful when they are tied to observable behavior rather than assumptions about who is trading.
Initiative Activity
Initiative activity occurs when participants are willing to conduct business away from previously accepted value. A breakout from prior value that holds and begins building new volume can be described as initiative behavior.
Responsive Activity
Responsive activity occurs when the market moves away from established value but encounters sufficient opposing response to return toward the prior area. A failed breakout above VAH that quickly trades back inside value is a classic example.
In Futures Auction Market Theory, the distinction is useful because it describes whether the market is extending the auction or defending prior value. It should not be used to claim knowledge of participant identity or future direction.
Common Auction Day Structures
Market Profile traders often classify sessions by the shape and distribution of the completed profile. Names vary by methodology, but the core idea is to describe how much directional extension developed beyond the Initial Balance and where value formed.
| Structure | Typical Character | Auction Interpretation | Risk to Avoid |
|---|---|---|---|
| Balanced / Normal | Most activity remains around central value | Two-sided trade dominates | Chasing edge breaks without acceptance |
| Trend Day | Directional extension with limited overlap | Persistent price discovery | Repeatedly fading the move |
| Double Distribution | Two distinct accepted areas separated by thinner structure | Auction migrated and built a second value region | Assuming old value still dominates automatically |
| Neutral / Broad Two-Sided | Extensions develop in both directions | Neither side maintains directional control | Forcing a directional narrative |
These classifications are descriptive. A trader should not wait until the session is finished and then claim the label predicted the day. The useful question is how the developing structure changes the probability of balance, continuation or rejection in real time.
TradeboticsAI Futures Auction Market Theory Framework
TradeboticsAI uses a five-stage framework to translate Futures Auction Market Theory into a repeatable decision process. This is an editorial framework, not a mechanical trading system.
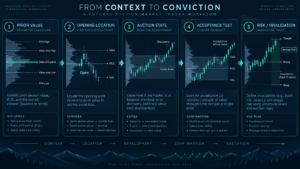
| Stage | Question | Evidence |
|---|---|---|
| 1. Prior Value | Where was the market accepted previously? | Prior VAH, VAL, POC, VWAP, profile structure |
| 2. Opening Location | Is price opening inside, above or below prior value? | Open relative to prior profile and overnight range |
| 3. Auction State | Is the market balancing or discovering price? | Overlap, range expansion, value migration, Initial Balance |
| 4. Acceptance Test | Are new prices attracting sustained business? | Time, volume, footprint, developing POC, retests |
| 5. Risk & Invalidation | What proves the auction thesis wrong? | Return to value, failed acceptance, structural break |
The information gain is that the framework separates location from confirmation. Opening above prior value is not automatically bullish. It becomes more meaningful only if the auction accepts those prices. Opening outside value and immediately returning inside tells a different story.
Practical Futures Auction Market Theory Example: ES
Consider a hypothetical ES session where the prior day’s value area is 6,490.00 to 6,510.00 and the prior POC is 6,501.00. Overnight trading lifts ES to 6,516.00, and the U.S. regular session opens at 6,515.00—above prior value.
At the open, Futures Auction Market Theory does not label the market bullish simply because price is above VAH. The first question is whether the auction can conduct business there.
Scenario A: Acceptance Above Value
ES trades between 6,513.00 and 6,519.00 for the first thirty minutes. Volume develops above the prior VAH, the developing POC forms near 6,516.00, and pullbacks to 6,512.00 are rejected. The footprint shows sellers hitting bids but failing to return price into prior value.
This behavior suggests that the market is accepting prices above yesterday’s value area. The auction is not merely testing higher—it is beginning to build new value there.
Scenario B: Rejection Back Into Value
Instead, assume ES opens at 6,515.00, trades briefly to 6,520.00 and then falls through 6,510.00. Time & Sales accelerates on the sell side, Volume Profile fails to build above VAH, and the developing POC shifts back toward 6,504.00.
Now the opening extension has failed. The auction tested higher prices but did not sustain trade there. Returning inside prior value increases the relevance of the prior POC and lower value references.
The two scenarios begin from the same opening price but produce opposite auction interpretations. That is the central strength of Futures Auction Market Theory: it focuses on how the market responds rather than assuming the location itself predicts the outcome.
Combining Futures Auction Market Theory With Order Flow
Auction theory tells the trader where and what state the market is in. Order flow can help explain how buyers and sellers are behaving inside that state.
Useful combinations include:
- VAH/VAL + footprint: test whether aggressive flow is accepted or absorbed at the edge of value.
- Initial Balance break + CVD: compare directional extension with aggressive participation.
- POC migration + Volume Profile: see whether the center of business is moving with price.
- Failed auction + Time & Sales: watch whether tape activity confirms the rejection.
- Value edge + DOM: observe whether passive liquidity remains or disappears when price arrives.
- VWAP + profile structure: compare volume-weighted average price with the developing auction.
This is where Futures Order Flow Trading 2026 complements the auction framework. Order flow should refine the auction thesis rather than replace it.
Explore NinjaTrader for TPO, Volume Profile, Order Flow+ and simulated futures trading
A Practical Futures Auction Market Theory Trading Workflow
- Confirm the active contract. During rollover, use the expiration carrying the relevant liquidity.
- Mark prior value. Record prior VAH, VAL, POC and other important profile references.
- Record the overnight range. Note whether the market is opening inside or outside prior value.
- Define the Initial Balance consistently. Use the same session template and time window each day.
- Classify balance or imbalance. Look for overlap, directional extension and value migration.
- Test acceptance. Ask whether time and volume are actually developing at the new prices.
- Use order flow selectively. Footprint, CVD, DOM or tape can confirm how participants are responding.
- Identify responsive or initiative behavior. Is price returning toward old value or building new value away from it?
- Define invalidation. Know what auction behavior would make the thesis no longer valid.
- Review after the session. Compare the real-time thesis with the completed profile without rewriting history.
This workflow keeps Futures Auction Market Theory descriptive and testable. It avoids the common mistake of assigning a market-profile label only after the session has already revealed the outcome.
Common Futures Auction Market Theory Mistakes
1. Treating Value as Guaranteed Support or Resistance
VAH, VAL and POC are references, not barriers. Price can move through them and build value elsewhere.
2. Assuming Outside Value Means Trend
Opening outside prior value is only location. Acceptance or rejection determines whether the extension is meaningful.
3. Confusing TPO With Volume Profile
TPO organizes time at price. Volume Profile organizes traded volume at price. Similar-looking profiles can produce different POCs and value areas.
4. Calling Every Fast Move Imbalance
A temporary impulse can fail immediately. In Futures Auction Market Theory, sustained price discovery should be confirmed by behavior after the move.
5. Ignoring Session Definitions
RTH and ETH profiles can produce different value references. Document the session used for every analysis.
6. Overfitting Profile Shapes
Profile names are descriptive tools, not deterministic patterns. Do not force every session into a textbook category.
7. Ignoring News and Volatility
Major economic information can rapidly create new value and invalidate previously useful structure.
8. Using Auction Theory Without Risk Management
No interpretation of acceptance, rejection or balance removes the substantial risk of futures trading.
Pros and Limitations of Futures Auction Market Theory
Pros
- Creates a coherent framework for market structure.
- Separates balance from directional price discovery.
- Explains acceptance and rejection more clearly than candles alone.
- Combines naturally with TPO, Volume Profile, VWAP and order flow.
- Encourages context before entry signals.
- Provides clear structural invalidation concepts.
Limitations
- Many terms are descriptive rather than predictive.
- Session settings materially change profile levels.
- Different platforms can calculate profiles differently.
- Day-type labels can encourage hindsight bias.
- Fast news-driven markets can rapidly reprice.
- Requires judgment and disciplined interpretation.
Best For
Futures Auction Market Theory is best suited to intraday and active futures traders who want a structural framework for understanding value, rotation, breakout acceptance and failed auctions.
Not Ideal For
It is less suitable for traders seeking a mechanical indicator with fixed buy and sell signals. The framework improves context, but the trader must still define entry logic, invalidation and risk.
Futures Auction Market Theory FAQ
What is Futures Auction Market Theory?
Futures Auction Market Theory views the futures market as a continuous two-way auction in which price searches for levels where buyers and sellers are willing to conduct business.
What is balance in Auction Market Theory?
Balance is a condition where trade repeatedly develops around an accepted price region. Price often rotates through value rather than moving persistently in one direction.
What is imbalance?
Imbalance is a directional auction in which the previous accepted area no longer contains price and the market searches for new participation and potentially new value.
What does price acceptance mean?
Acceptance means the market continues conducting business around a price area. Evidence can include time, volume, overlapping trade, developing POC or successful retests.
What does rejection mean?
Rejection occurs when price tests an area but cannot sustain meaningful trade there and quickly moves away or returns to the prior accepted range.
Is Auction Market Theory the same as Market Profile?
No. Market Profile is a visualization tool that organizes time and price information. Futures Auction Market Theory is the broader framework for interpreting the auction process.
What is TPO?
TPO means Time Price Opportunity. TPO charts represent periods in which the market traded at particular price levels and help visualize time-based acceptance.
What is the difference between Market Profile and Volume Profile?
Market Profile commonly uses time at price, while Volume Profile measures actual traded volume at price. Their POCs and value areas can differ.
What is Initial Balance?
Initial Balance is the early-session price range used by Market Profile traders. Many classic workflows use the first hour of the regular session, but platform settings and methodologies can vary.
What is initiative activity?
Initiative activity describes trading that successfully moves away from previously accepted value and begins conducting business at new prices.
What is responsive activity?
Responsive activity describes opposing participation that rejects an excursion away from established value and pushes the market back toward the prior accepted area.
Can Auction Market Theory predict futures prices?
No. Futures Auction Market Theory provides a framework for describing acceptance, rejection, balance and price discovery. It does not guarantee future market direction.
Does NinjaTrader support Market Profile?
NinjaTrader publishes Market Profile/TPO educational material and supports profile-based and order-flow analysis in its trading ecosystem. Feature availability and platform packaging can change, so verify current functionality directly before purchasing a plan for a specific tool.
Final Verdict: How to Use Futures Auction Market Theory Correctly
Futures Auction Market Theory is most useful because it replaces a simplistic question—“will price go up or down?”—with more observable questions. Is the market balanced? Is it discovering new prices? Are those prices being accepted? Did the breakout build new value or fail back into the old auction?
TPO Market Profile can show where the market spent time. Volume Profile can show where contracts actually traded. VWAP can provide a volume-weighted benchmark. Footprint charts, CVD, DOM and Time & Sales can reveal how participants are behaving around those locations.
The framework becomes strongest when the trader separates location from confirmation. Prior VAH, VAL, POC and Initial Balance define reference points, but the subsequent auction determines whether those levels matter today.
Use Futures Auction Market Theory as the structural layer beneath Market Profile, Volume Profile, VWAP and Order Flow Trading. The objective is not to predict every move—it is to understand whether the market is accepting current prices or still searching for somewhere else to conduct business.
Explore NinjaTrader for TPO, profiles, order flow and futures simulation
Affiliate Disclosure: TradeboticsAI may receive compensation when eligible users complete a qualifying action through certain affiliate links. Affiliate relationships do not determine our editorial conclusions.
Risk Disclosure: Futures trading involves substantial risk of loss and is not suitable for every investor. Auction Market Theory, TPO, Market Profile, Volume Profile, VWAP, order flow and historical auction behavior do not predict future returns. Simulated and backtested results are hypothetical and do not guarantee future live performance. Nothing on this page is personalized investment, financial, tax or trading advice.