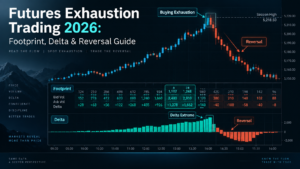
Futures Exhaustion Trading 2026: Footprint, Delta & Reversal Guide
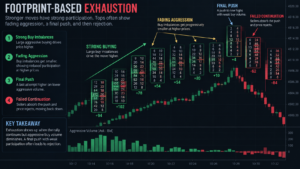
Futures Exhaustion Trading studies moments when aggressive buyers or sellers lose the participation needed to continue pushing price. Unlike absorption—where heavy aggressive flow is actively met by passive liquidity—exhaustion occurs when the attacking side begins running out of activity. On footprint charts this can appear as reduced executed volume near an extreme, weakening delta, failed continuation or a final push that attracts little follow-through. Exhaustion can help explain short-term reversals and failed auctions, but it is not a standalone reversal signal: price still needs to confirm that the prior directional auction has actually ended.
Quick Answer
Futures Exhaustion Trading looks for directional price movement that is reaching new extremes with progressively less aggressive participation. A common buying-exhaustion pattern is price making a new high while ask-side volume, delta or follow-through weakens; selling exhaustion is the opposite near a new low. Footprint charts, Cumulative Delta, Time & Sales and Auction Market Theory can help confirm the condition. The highest-quality exhaustion setup combines an important location, reduced directional participation, failed price progress and an opposite-side response.
Explore NinjaTrader for Volumetric Bars, Cumulative Delta and futures simulation
Affiliate Disclosure: TradeboticsAI may earn compensation when an eligible user completes a qualifying action through an affiliate link, at no additional cost to the user. Affiliate relationships do not determine our editorial conclusions.
What Is Futures Exhaustion Trading?
Futures Exhaustion Trading is an order-flow approach that looks for evidence that the aggressive side of an auction is losing the ability or willingness to continue trading at increasingly unfavorable prices.
NinjaTrader’s footprint-chart education distinguishes exhaustion from absorption. Absorption involves substantial volume trading at a level without corresponding price progress. Exhaustion instead occurs when one side pushes aggressively and then begins to run out of fuel, often near an extreme.
This distinction is fundamental. A market can reverse because large passive orders stopped aggressive flow, or because aggressive traders simply stopped participating. Both situations can produce a turning point, but the underlying order-flow mechanics are different.
For example, imagine NQ has been rising steadily. Buyers repeatedly cross the spread and lift offers. Near a session high, price trades to another new high but only a small amount of ask-side volume executes there. The next attempt produces even less participation and price falls back into the prior range.
That sequence is a potential Futures Exhaustion Trading condition: buyers continued reaching higher prices, but fewer aggressive buyers were willing to pay those increasingly expensive offers.
Official reference:
NinjaTrader Footprint Charts Guide.
How Futures Exhaustion Trading Develops
Every aggressive futures transaction requires someone to cross the spread. Buyers pay available offers; sellers trade into available bids. A sustained directional move therefore requires continued aggressive participation or sufficiently weak opposing liquidity.
During an upward auction:
- aggressive buyers repeatedly lift offers;
- price moves upward searching for additional sellers;
- new offers are consumed or withdrawn;
- buyers must continue accepting higher prices to maintain the move;
- eventually fewer buyers may be willing to continue;
- the auction can stall even without a massive passive seller appearing.
Futures Exhaustion Trading focuses on stages five and six.
The important concept is diminishing participation. Price can still make one final new extreme because only a small amount of liquidity is required to print another tick. That does not necessarily mean the directional auction remains healthy.
Exhaustion can therefore create an apparent contradiction: price makes a new extreme while participation weakens.
This is why traders should not analyze price distance alone. A move that has traveled far can continue much farther when participation remains strong. Conversely, a relatively small move can fail when the aggressive side suddenly disappears.
Buying Exhaustion vs Selling Exhaustion
Futures Exhaustion Trading can identify fading participation on either side of the market.
| Condition | Prior Move | Aggressive Side Fading | Typical Observation |
|---|---|---|---|
| Buying Exhaustion | Rising market | Aggressive buyers | New high with reduced ask-side participation and weak follow-through |
| Selling Exhaustion | Falling market | Aggressive sellers | New low with reduced bid-side participation and weak continuation |
Buying Exhaustion
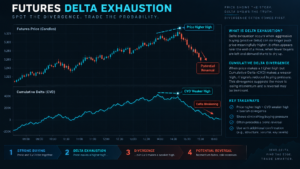
Buying exhaustion appears when buyers have repeatedly paid higher prices but the volume or delta supporting the advance begins declining. A new high can print with very little aggressive buying at the extreme before price returns lower.
Selling Exhaustion
Selling exhaustion appears when sellers have repeatedly accepted lower bids but participation begins drying up. Price may make one final low on limited selling activity before buyers begin reclaiming previous prices.
Neither condition should automatically trigger a reversal trade. The fading side can return immediately. Futures Exhaustion Trading becomes stronger only when the opposing side actually begins taking control.
How Futures Exhaustion Trading Looks on a Footprint Chart
Footprint charts are particularly useful because they show executed buy and sell volume at individual price levels rather than only the completed candle.
NinjaTrader’s Volumetric Bars can display bid/ask volume, delta, bar-level statistics, maximum volume and cumulative-delta information. BidAsk-style Volumetric Bars classify volume executed at the ask as buying pressure and volume executed at the bid as selling pressure.
Common footprint clues for Futures Exhaustion Trading include:
- progressively lower aggressive volume as price reaches new extremes;
- very small transaction counts at the final price levels of a move;
- shrinking bar delta despite continuing price progress;
- a final directional extension that immediately fails;
- absence of stacked continuation imbalance after the extreme;
- opposite-side aggression appearing shortly afterward.
One isolated low-volume print is not enough. Markets naturally contain price levels with fewer transactions. The stronger evidence comes from the sequence: strong participation earlier in the move, weaker participation later, and eventual failure to continue.
For the complete price-level framework, see Futures Footprint Charts 2026.
Futures Exhaustion Trading vs Absorption
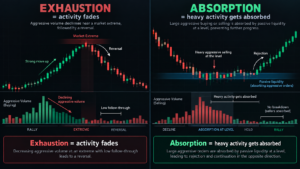
Absorption and exhaustion are frequently confused because both can occur before a reversal. Their order-flow signatures are almost opposite.
| Feature | Exhaustion | Absorption |
|---|---|---|
| Aggressive Volume | Declining | Heavy |
| Reason Progress Stops | Aggressive side loses participation | Passive side absorbs aggressive flow |
| Footprint Clue | Thin / declining activity at extreme | Large volume with poor price progress |
| Core Question | Who stopped attacking? | Who is successfully defending? |
| Reversal Guaranteed? | No | No |
NinjaTrader explicitly identifies both absorption and exhaustion as important footprint patterns. Absorption occurs when large volume trades but price fails to move through a level. Exhaustion occurs when one side pushes aggressively and runs out of participation.
A market can also transition between the two. Sellers can initially attack a low heavily and become absorbed; after several attempts, their transaction volume can then decline as selling becomes exhausted.
That combination can provide stronger context than either observation alone.
See Futures Absorption Trading 2026 for the complementary setup.
Delta and Cumulative Delta in Futures Exhaustion Trading
Delta measures the imbalance between aggressively executed buying and selling under the selected classification method. NinjaTrader’s Volumetric Bars and Cumulative Delta tools can calculate delta using BidAsk or UpDownTick methodologies.
For Futures Exhaustion Trading, traders can compare how delta evolves during the move.
Example: Buying Exhaustion
Suppose ES advances through four successive swing highs:
- first push: +1,800 bar delta;
- second push: +1,250;
- third push: +620;
- final new high: +140.
Price is still advancing, but aggressive buying is becoming progressively weaker.
This pattern is not automatically bearish. Passive sell liquidity may simply be thin enough that even moderate buying continues moving price. The setup gains significance if price then fails to hold the new high and selling begins appearing.
Cumulative Delta Divergence
CVD can provide broader context. NinjaTrader documents the use of Cumulative Delta to compare price highs and lows with underlying buy/sell pressure and specifically warns that the indicator can produce false signals.
If price reaches a new high but CVD fails to confirm it, the divergence can support an exhaustion hypothesis. It should trigger investigation—not an automatic short trade.
See Futures Cumulative Delta 2026 for the complete divergence framework.
Time & Sales Confirmation for Futures Exhaustion Trading
Time & Sales can reveal changes in transaction speed and size during Futures Exhaustion Trading.
During a strong upward move, tape activity may show frequent ask-side transactions and larger prints. Near exhaustion, the sequence may change:
- transaction frequency begins slowing;
- aggressive buys become smaller or less consistent;
- price attempts another high;
- few transactions occur at the extreme;
- sell-side transactions begin increasing;
- price returns to previously traded levels.
The tape is useful because it records executed business rather than resting intentions. A DOM can display large bids or offers that later disappear. Time & Sales shows transactions that actually occurred.
However, raw tape speed varies dramatically across ES, NQ, CL and other contracts. Traders should learn what normal activity looks like for the instrument and session before interpreting relative slowdown.
See Futures Time and Sales 2026 for tape-reading methodology.
Futures Exhaustion Trading and Auction Market Theory
Auction Market Theory provides useful context for Futures Exhaustion Trading. Price continually searches for areas where two-sided trade can develop. A directional auction continues while participants are willing to transact at increasingly distant prices.
Exhaustion can appear when that auction reaches an area where the attacking side no longer provides enough transactions to continue discovery.
Suppose ES leaves prior value and rallies toward the previous week’s high. Initially the move shows strong initiative buying. Near the high, transaction volume decreases sharply, the profile fails to build meaningful value above the reference and price returns inside the previous auction.
The order-flow interpretation is buying exhaustion. The auction interpretation is failed acceptance at higher prices.
When both frameworks agree, the market provides more information than either tool alone.
See Futures Auction Market Theory 2026 and Futures Liquidity Sweep 2026 for failed-auction and breakout-rejection analysis.
Where Futures Exhaustion Trading Matters Most
Exhaustion can appear anywhere, but not every occurrence deserves a trade. Location can dramatically change the information value of the same pattern.
Higher-quality areas can include:
- prior-day high or low;
- overnight high or low;
- weekly extremes;
- Value Area High or Value Area Low;
- Initial Balance extensions;
- VWAP bands;
- low-volume nodes;
- clear breakout boundaries;
- previously rejected auction extremes.
For example, small ask volume at the high of a random one-minute candle means little by itself. The same declining participation after a sustained rally into prior-week resistance can be much more relevant.
This location-first process prevents Futures Exhaustion Trading from becoming a search for reversal patterns on every bar.
Use Futures Volume Profile 2026, Futures Market Profile 2026 and Futures VWAP 2026 to define those locations before the setup appears.
TradeboticsAI Futures Exhaustion Trading Quality Score
TradeboticsAI uses the following five-factor framework to separate meaningful exhaustion from ordinary variation in volume. This is an editorial framework, not a mechanical trading system.
| Factor | Weak | Medium | Strong |
|---|---|---|---|
| Prior Direction | Little directional move | Clear swing | Extended initiative move |
| Location | Random range midpoint | Local structure | Major pre-defined auction level |
| Participation Change | No clear reduction | Moderate slowdown | Clear decline across multiple attempts |
| Price Progress | Continues normally | Begins slowing | New extreme fails immediately |
| Opposite Response | None | Initial counter-flow | Strong reclaim / opposite aggression |
A strong Futures Exhaustion Trading setup should therefore answer five questions: Was there a meaningful directional move? Did it reach an important location? Did aggressive participation weaken? Did price stop responding? Did the opposite side actually appear?
Practical Futures Exhaustion Trading Example: ES Buying Exhaustion
Consider a hypothetical ES session. The market opens above prior value and trends upward for ninety minutes. The previous week’s high sits at 6,525.00.
During the move:
- the first impulse bar records approximately +1,900 delta;
- the next directional push records +1,350;
- another new swing high records +720;
- ES finally trades 6,525.50, but the breakout bar records only +180 delta;
- very little ask-side volume trades at the highest two price levels;
- CVD fails to produce a meaningful new high;
- ES immediately returns below 6,525.00.
This is a potential buying-exhaustion sequence. Price achieved a new extreme, but progressively less aggressive buying supported each extension.
The trade thesis should not begin merely because the +180 delta looks small. Confirmation comes when price returns below the prior-week high and aggressive selling begins appearing.
If ES instead consolidates above 6,525.00, new buyers appear and the developing Volume Profile begins building above the level, the exhaustion thesis weakens. The market may have paused rather than reversed.
This example illustrates why Futures Exhaustion Trading requires both fading participation and subsequent market response.
Futures Exhaustion Trading vs a Temporary Pause
One of the hardest problems is determining whether reduced volume means the move is exhausted or merely resting before continuation.
A temporary pause can also show:
- lower transaction speed;
- smaller delta;
- narrower price bars;
- reduced volume;
- short-term consolidation.
The difference often comes from what happens next.
| After Slowdown | More Consistent With Exhaustion | More Consistent With Continuation |
|---|---|---|
| Price | Fails extreme and reclaims prior structure | Holds near extreme |
| Opposite Flow | Appears aggressively | Remains weak |
| Profile | Fails to build new value | Builds acceptance near new prices |
| Next Impulse | Opposite direction | Original direction resumes |
The rule is simple: declining participation is evidence of exhaustion only when the auction subsequently fails.
A Practical Futures Exhaustion Trading Workflow
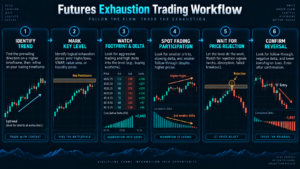
- Confirm the active futures contract. Use the expiration carrying meaningful volume and liquidity.
- Identify a directional auction. Exhaustion needs a move that can actually run out of participation.
- Mark important destination levels. Prior highs/lows, profile edges, VWAP bands and liquidity-sweep levels provide context.
- Establish baseline order flow. Note the normal delta, volume and tape activity during the earlier portion of the move.
- Watch participation at new extremes. Compare later pushes with earlier ones rather than using arbitrary thresholds.
- Look for declining aggression. Footprint volume, delta or tape intensity should meaningfully weaken.
- Require failed progress. A new extreme should stop producing sustained continuation.
- Wait for opposite-side confirmation. Reclaim, counter-delta or aggressive opposing prints improve the thesis.
- Define invalidation. Renewed participation and acceptance beyond the extreme invalidate many exhaustion setups.
- Review the sequence afterward. Save examples of both reversals and false exhaustion signals.
This workflow prevents Futures Exhaustion Trading from becoming an attempt to pick tops and bottoms simply because volume declined.
Explore NinjaTrader Order Flow+ and practice exhaustion analysis in simulation
Common Futures Exhaustion Trading Mistakes
1. Treating Low Volume as Automatic Reversal
Volume can decline during ordinary consolidation. A reversal requires additional evidence that the prior auction has failed.
2. Confusing Exhaustion With Absorption
Absorption contains substantial aggressive activity that fails to move price. Exhaustion contains diminishing aggressive activity.
3. Shorting Every New High With Smaller Delta
A trend can continue even as individual delta readings decline. Price response matters more than one number.
4. Ignoring Location
Futures Exhaustion Trading is generally more useful near pre-defined auction extremes than in the center of a random range.
5. Trading Before the Opposite Side Appears
Buyers can pause and then return. Sellers can pause and resume. Wait for evidence that control is actually changing.
6. Assuming CVD Divergence Guarantees Reversal
NinjaTrader explicitly notes that Cumulative Delta can generate false signals. Divergence should be interpreted as context.
7. Ignoring Data Methodology
BidAsk and UpDownTick delta classifications are not identical. Historical BidAsk analysis also requires appropriate bid/ask-stamped tick data.
8. Using Excessive Leverage at Extremes
No exhaustion pattern guarantees that a market has reached its final high or low.
Pros and Limitations of Futures Exhaustion Trading
Pros
- Measures changes in real executed participation.
- Can identify weakening momentum before candles make it obvious.
- Pairs naturally with footprint, delta and tape.
- Complements Auction Market Theory and failed-breakout analysis.
- Creates a clear distinction from absorption.
- Can improve timing around important market extremes.
Limitations
- Falling volume does not guarantee reversal.
- Directional participation can return suddenly.
- Different instruments have different normal transaction patterns.
- Platform delta methodologies can vary.
- Fast markets can make confirmation difficult.
- Requires judgment rather than a fixed universal threshold.
Best For
Futures Exhaustion Trading is most useful for intraday futures traders studying failed auctions, trend termination, liquidity sweeps and short-term reversal conditions with transaction-level data.
Not Ideal For
It is less suitable for traders seeking automatic top-and-bottom signals or anyone relying only on standard candles without access to reliable volume and order-flow data.
Futures Exhaustion Trading FAQ
What is Futures Exhaustion Trading?
Futures Exhaustion Trading analyzes situations where the aggressive buyers or sellers driving a directional move begin losing participation near a market extreme.
What does exhaustion look like on a footprint chart?
Common clues include declining aggressive volume at new extremes, shrinking delta, weak transaction activity at the final prices and a subsequent failure to continue.
What is buying exhaustion?
Buying exhaustion occurs when aggressive buyers become less willing or able to continue lifting offers at increasingly higher prices.
What is selling exhaustion?
Selling exhaustion occurs when aggressive sellers begin reducing activity as price reaches new lows, leaving insufficient selling pressure to continue the move.
What is the difference between exhaustion and absorption?
Exhaustion involves aggressive activity drying up. Absorption involves strong aggressive activity being met successfully by passive liquidity.
Does lower delta mean a trend is exhausted?
No. Lower delta is one clue. Price can continue moving even with lower delta, especially when opposing liquidity is thin.
Can Cumulative Delta confirm exhaustion?
CVD divergence can support an exhaustion hypothesis when price reaches a new extreme without equivalent aggressive-flow confirmation. It can also generate false signals.
Is exhaustion a reversal signal?
It can precede reversals, but Futures Exhaustion Trading should require failed continuation and opposite-side response rather than assuming the first slowdown marks the turning point.
Can exhaustion happen after a liquidity sweep?
Yes. A stop-triggered breakout can create a final burst of transactions and then lose participation, producing a failed auction. See the TradeboticsAI Futures Liquidity Sweep guide for that sequence.
What tools are best for exhaustion analysis?
Footprint or Volumetric Bars are the primary tool. Cumulative Delta, Time & Sales, Volume Profile, Market Profile and DOM can provide additional context.
Does NinjaTrader support exhaustion analysis?
Yes. NinjaTrader documents exhaustion as a footprint/order-flow pattern and provides Volumetric Bars and Cumulative Delta through its Order Flow+ toolset. Verify current product access and pricing directly with NinjaTrader.
Which futures contracts work best for exhaustion analysis?
Actively traded exchange-listed futures with reliable transaction data are generally easier to study. The appropriate instrument still depends on the trader’s risk tolerance, session, strategy and data setup.
Final Verdict: How to Use Futures Exhaustion Trading Correctly
Futures Exhaustion Trading is useful because price direction alone cannot show whether the traders driving a move still have the participation required to continue it.
The strongest exhaustion sequence is not simply “volume fell.” It is:
directional auction → important destination → diminishing aggression → weak price progress → failed extreme → opposite-side response.
Footprint charts expose transaction activity at individual prices. Delta measures aggressive imbalance. Cumulative Delta shows whether broader pressure is confirming price. Time & Sales reveals changes in transaction speed, while Auction Market Theory explains whether the market successfully accepted the newly reached prices.
Use Futures Exhaustion Trading alongside Absorption Trading, Order Flow Trading, Liquidity Sweep analysis and Auction Market Theory. Exhaustion tells you the attacking side may be running out of fuel; price response tells you whether that information actually mattered.
Explore NinjaTrader for Volumetric Bars, Cumulative Delta and futures order-flow tools
Affiliate Disclosure: TradeboticsAI may receive compensation when eligible users complete a qualifying action through certain affiliate links. Affiliate relationships do not determine our editorial conclusions.
Risk Disclosure: Futures trading involves substantial risk of loss and is not suitable for every investor. Exhaustion, delta, footprint patterns, Cumulative Delta, Time & Sales, liquidity sweeps and order-flow analysis do not predict future returns. Participation can return after an apparent exhaustion signal, and simulated results do not guarantee future live performance. Nothing on this page is personalized investment, financial, tax or trading advice.