Trading Expectancy Calculator 2026: Free Futures Edge Tool
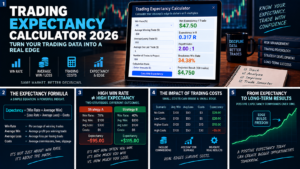
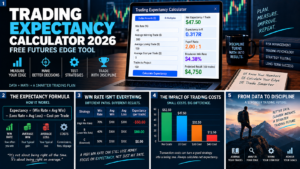
Use this trading expectancy calculator to estimate the average value of a trading strategy from its win rate, average winner, average loser and trading costs. The tool works in dollars or R-multiples and returns gross expectancy, net expectancy after costs, payoff ratio, modeled profit factor, breakeven win rate and an input-based projection over a selected number of trades.
For futures traders, a trading expectancy calculator can be more informative than win rate alone. A strategy can lose more trades than it wins and still show positive mathematical expectancy if its average winners are sufficiently larger than its average losers. The opposite is also true: a high win rate can still produce negative expectancy when losses are too large or transaction costs consume too much of the average gain.
Quick Answer
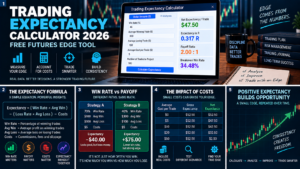
A trading expectancy calculator estimates what one trade is worth on average if the entered win rate, average win, average loss and costs remain representative. The basic formula is (win rate × average win) − (loss rate × average loss) − cost per trade. A positive result describes positive mathematical expectancy under the inputs; it does not guarantee profits, predict the next trade or prove that the historical sample will persist.
Affiliate Disclosure: TradeboticsAI may receive compensation when readers complete qualifying actions through certain links. NinjaTrader buttons on this page are affiliate links. Calculator outputs and editorial conclusions are independent of compensation.
Trading Expectancy Calculator
This interactive trading expectancy calculator supports two modes. Dollar mode uses average winning and losing trades in dollars. R-multiple mode expresses each result relative to one unit of risk, which can make strategy comparisons easier across account sizes and futures contracts. Costs should be entered in the same unit as the average win and average loss.
Calculate Strategy Expectancy
—
—
—
—
—
—
—
—
—
Educational scenario only. The projection is simple arithmetic based on the inputs and is not a forecast. Historical win rate, average wins, average losses, costs and execution quality can change. Small or selected samples can materially misrepresent future performance.
How a Trading Expectancy Calculator Works
A trading expectancy calculator combines frequency and payoff into one weighted average. Win rate tells you how often winning trades occur. Average win tells you how large those winners are. Loss rate and average loss describe the losing side. Expectancy combines all four pieces, then optionally subtracts transaction costs.
Consider two strategies. Strategy A wins 70% of its trades but earns $100 on average when right and loses $300 when wrong. Strategy B wins only 40% but earns $300 when right and loses $100 when wrong. Win rate makes Strategy A look stronger, yet the weighted math can favor Strategy B. The trading expectancy calculator exposes that difference immediately.
For futures, the calculation should ideally use realized results after the correct contract values, commissions, slippage and fees have been reconciled. Mixing gross backtest results with net live-trading statistics can produce a misleading comparison.
Trading Expectancy Calculator Formula
The core trading expectancy calculator equation is:
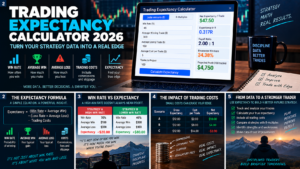
Gross expectancy = (win probability × average win) − (loss probability × average loss)
When trading costs are modeled separately:
Net expectancy = gross expectancy − average cost per trade
Because win probability plus loss probability equals 100% in a simplified win/loss model, loss probability can be calculated as 1 minus win probability.
If a strategy wins 45% of the time, averages $300 on winning trades, loses $150 on losing trades and pays $5 in average round-trip costs, gross expectancy is $52.50 per trade and net expectancy is $47.50. That number means the entered statistics imply an average of +$47.50 per trade across a sufficiently representative sample. It does not mean the next trade should make $47.50.
R-multiples provide another way to use a trading expectancy calculator. If an average loss is defined as 1R, an average winner of 2R with a 40% win rate produces gross expectancy of +0.20R per trade before costs. Expressing results in R can help compare strategies traded with different dollar sizes.
CME Mathematical Expectation Example
CME Group teaches the same core concept in its futures trading education. In its “Mathematics of Trading Success” lesson, CME uses an example with a 40% winning frequency, winners averaging three risk units and losers averaging one risk unit.
The arithmetic is (0.40 × 3) − (0.60 × 1) = +0.60 risk units. The example illustrates why a trader can be wrong more often than right and still have positive mathematical expectation when winners are materially larger than losers.
See the
official CME Group lesson on mathematical expectation
for the exchange's educational explanation.
A trading expectancy calculator converts that idea into a reusable tool. Instead of focusing on the emotional appeal of a high win rate, it asks whether the combination of win frequency and payoff produces a positive average under the measured sample.
Trading Expectancy vs Win Rate
A trading expectancy calculator shows why win rate by itself is incomplete. A strategy can win 80% of the time and still lose money if the remaining 20% of trades are large enough. A strategy can also win only 35% of the time and remain positive if its winners are substantially larger than its losers.
Win rate should therefore be interpreted beside average win and average loss. If a trader improves win rate by taking profits much earlier but leaves stop size unchanged, the higher percentage of winning trades may be offset by a lower payoff ratio. The strategy can feel more comfortable while mathematical expectancy deteriorates.
Likewise, a lower win rate is not automatically evidence of a bad strategy. Trend-following and breakout systems can rely on infrequent larger winners. The trading expectancy calculator focuses on what the complete combination produced instead of judging a method only by the percentage of winning trades.
Trading Expectancy vs Risk/Reward Ratio
Risk/reward ratio and expectancy are related but not interchangeable. Risk/reward describes the planned geometry of one trade: the distance from entry to stop compared with the distance from entry to target. Expectancy describes the weighted average of many realized winners and losers.
A planned 3:1 target does not prove that average winners will actually be 3R. Traders can exit early, trail stops, scale out, miss targets or experience slippage. The trading expectancy calculator should therefore use realized average wins and losses when evaluating historical performance rather than assuming every trade reached the original target.
Use our
Futures Risk Reward Calculator 2026
to evaluate stop and target geometry before a trade. Then use the expectancy calculation after a meaningful sample to evaluate what those trades actually produced on average.
Commissions, Fees and Slippage in Trading Expectancy
Costs can turn a small positive gross edge into a negative net result. This is particularly important in futures scalping, where strategies may produce many round trips and relatively small average winners.
A trading expectancy calculator should therefore account for average cost per trade when possible. Explicit costs include brokerage commissions, exchange charges, clearing fees and regulatory fees. Slippage and bid/ask effects are execution costs even when they do not appear as a separate broker commission line.
For example, a strategy with +$12 gross expectancy per trade and $8 of average total costs has only +$4 net expectancy. If costs rise to $14 while the strategy remains unchanged, the same gross edge becomes -$2 after costs.
The trading expectancy calculator is most useful when the cost input matches the strategy being measured. A high-frequency MES strategy can have a different cost burden from a lower-turnover ES strategy even if their directional logic is similar.
Use our
Futures Commission Calculator 2026
to estimate explicit round-trip costs and fee breakeven in ticks.
Sample Size, Variance and Backtest Overfitting
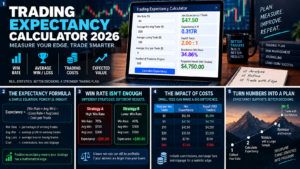
A positive output from a trading expectancy calculator is only as reliable as the inputs. Ten trades can produce an impressive win rate and average payoff by chance. A larger sample does not guarantee future performance, but it normally provides more information about the range of outcomes the strategy has actually experienced.
Sample quality matters as much as sample size. Combining several different strategies, markets, timeframes or rule sets into one data set can produce an average that describes none of them accurately. If an ES opening-range strategy and a crude-oil trend strategy behave differently, calculate them separately before combining portfolio-level results.
Backtests also face selection bias and overfitting. Rules created after repeatedly examining the same historical data can appear to have strong expectancy because they were tailored to that sample. Out-of-sample testing, walk-forward analysis and forward simulation can help reveal whether the result survives outside the development data.
The projection produced by this trading expectancy calculator is intentionally labeled input-based. Multiplying expectancy by 100 trades does not simulate the order of wins and losses, drawdowns, losing streaks or changing market regimes.
Using a Trading Expectancy Calculator for Futures
Futures traders should calculate expectancy from correctly normalized trade data. ES, MES, NQ, MNQ, CL and GC have different tick values, contract sizes and fee structures. Dollar expectancy can change simply because position size changed, even when the underlying strategy quality did not.
This is where R-multiple analysis becomes useful. If every trade is expressed relative to the initial risk taken, the trading expectancy calculator can compare a $50-risk MES sample with a $500-risk ES sample on a more consistent basis. A +0.20R expectancy describes the average in units of risk rather than account currency.
R normalization is not perfect. Actual risk can differ from planned risk because of gaps, slippage, partial fills and discretionary exits. Still, it can make cross-contract and cross-account strategy comparisons more meaningful than raw dollars alone.
Use our
Futures Tick Value Calculator 2026
to verify contract economics and our
Futures Position Size Calculator 2026
to convert stop distance and dollar-risk budget into whole-contract quantity.
Trading Journals, Backtesting and Expectancy
The best inputs for a trading expectancy calculator usually come from a reconciled trading journal or a well-structured backtest. The journal should separate strategies, contracts, accounts, simulated trades and live trades so the averages are not contaminated by unrelated samples.
Track at least win/loss outcome, realized P&L, initial risk, commissions, slippage and setup tag when possible. Once those fields are consistent, the trading expectancy calculator can be rerun by setup, instrument, time of day or market regime.
See our
Best Futures Trading Journals 2026
for tools that can organize realized results, and our
Best Futures Backtesting Platforms 2026
for strategy-testing software.
A journal can reveal whether planned 2R winners are actually averaging only 1.2R or whether losses intended to stop at -1R are drifting to -1.4R. Those differences directly change expectancy.
Trading Expectancy for Automated Futures Strategies
Automated trading makes expectancy analysis easier to standardize but does not make the result permanent. An algorithm can apply the same entry and exit rules repeatedly, which improves data consistency, yet market structure, volatility, liquidity and transaction costs can still change.
A trading expectancy calculator can be used as a monitoring layer for an automated strategy. Compare rolling live expectancy with the backtest and forward-test baseline. If win rate, payoff ratio or net expectancy deteriorates materially, investigate whether the change comes from market regime, execution, data quality, software behavior or statistical variance.
For automated systems, rerunning the trading expectancy calculator on rolling windows can also show whether a result is broadly stable or concentrated in one unusually strong period. That is diagnostic information, not an automatic signal to increase or decrease live risk.
Do not automatically disable or increase an algorithm based on one short sample. The correct monitoring threshold depends on the strategy's normal variance and number of observations.
For platform comparisons, see
Best Automated Futures Trading Software 2026
.
Trading Expectancy and Futures Prop-Firm Accounts
Prop-firm traders face another layer of constraints. A strategy can have positive mathematical expectancy yet still be poorly matched to an account with a tight trailing drawdown, daily loss cap or consistency rule. The path of returns matters when account rules can terminate trading before the strategy has enough trades to express its long-run average.
The trading expectancy calculator should therefore be used beside account-level risk tools rather than as a payout or survival calculator. A +0.30R average does not tell you the probability of hitting a trailing threshold during a losing streak.
Use our
Prop Firm Drawdown Calculator 2026
for loss-floor scenarios and our
Prop Firm Consistency Rule Calculator 2026
for best-day concentration rules.
Keep evaluation data, simulated funded data and live brokerage data clearly separated. They can have different execution conditions and behavioral pressures, so combining them may hide meaningful differences.
Common Trading Expectancy Calculator Mistakes
Using Planned Winners Instead of Realized Average Winners
A 3R target does not mean average winners equal 3R. Use realized outcomes when evaluating historical strategy expectancy with the trading expectancy calculator.
Ignoring Trading Costs
Commissions and slippage can materially reduce small edges. Use net data or subtract average cost per trade.
Judging a Strategy From Win Rate Alone
Win rate must be combined with average win and average loss. A high hit rate can coexist with negative expectancy.
Mixing Different Strategies in One Sample
Separate materially different setups, markets and rule sets before calculating strategy-specific averages.
Trusting a Tiny Sample
A small number of trades can produce unstable statistics. The trading expectancy calculator cannot determine whether the sample is representative.
Treating the Projection as a Forecast
Expectancy multiplied by 100 trades is an arithmetic scenario. It does not predict the sequence, variance or drawdown of future results.
Ignoring Changes in Position Size
Raw dollar expectancy can rise simply because more contracts were traded. R-multiples can make normalized comparisons easier.
Assuming Positive Historical Expectancy Is Permanent
Markets evolve. Execution quality, costs, volatility and competitive conditions can change, so expectancy should be monitored rather than frozen forever.
Trading Expectancy Calculator FAQ
What is a trading expectancy calculator?
A trading expectancy calculator estimates the average value of one trade from win probability, average win, average loss and optional trading costs.
What is the trading expectancy formula?
The standard formula is win rate multiplied by average win minus loss rate multiplied by average loss. Subtract average trading cost per trade when you want a cost-adjusted estimate.
Can a strategy be profitable with a 40% win rate?
Mathematically, yes. If average winners are sufficiently larger than average losers and costs do not consume the edge, a strategy can have positive expectancy with a win rate below 50%. That does not guarantee future profitability.
Can a strategy lose money with an 80% win rate?
Yes. A small number of very large losses can outweigh many small winners. Win rate alone does not measure expectancy.
What is expectancy in R?
Expectancy in R expresses the average outcome relative to one unit of risk. A result of +0.25R means the input sample averaged one-quarter of a risk unit per trade.
What is a good trading expectancy?
There is no universal threshold that makes a strategy suitable. A small positive expectancy may be vulnerable to costs and estimation error, while a larger historical expectancy can still fail out of sample. Consider sample quality, drawdown, variance and execution.
Does positive expectancy guarantee profit?
No. A positive trading expectancy calculator result is a weighted-average estimate under the values entered. Future market conditions and realized outcomes can differ.
Should commissions be included?
Yes when evaluating net strategy economics. Use actual or realistically estimated commissions, exchange fees, clearing charges and slippage where appropriate.
How many trades do I need?
There is no single number that guarantees reliability. More observations generally provide more information, but a large biased or overfit sample can still mislead. Keep the strategy definition consistent and use out-of-sample testing when possible.
Is expectancy the same as risk/reward?
No. Risk/reward describes potential or planned payoff for a trade. The trading expectancy calculator combines realized win rate and average outcomes across many trades.
Final Verdict: Trading Expectancy Calculator for 2026
A useful trading expectancy calculator should answer a simple question: given the win rate, average winner, average loser and trading costs measured in a defined sample, what is the weighted-average value of one trade under those inputs?
That single number is more informative than win rate alone because it forces frequency and payoff into the same equation. For futures traders, expressing the result in R can make comparisons cleaner across ES, MES, NQ, MNQ and other contracts with very different dollar values and position sizes.
Use the trading expectancy calculator with clean journal or backtest data, include costs, separate different strategies, and treat projections as scenarios rather than forecasts. Positive historical expectancy is evidence about a measured sample, not a guarantee that the next trade, month or market regime will behave the same way.
Combined with position sizing, risk/reward analysis, commission tracking, backtesting and drawdown controls, the trading expectancy calculator becomes one component of a more disciplined futures research process rather than a promise of future performance.