Futures Previous Day High and Low 2026: PDH, PDL, Breakouts & Liquidity Guide
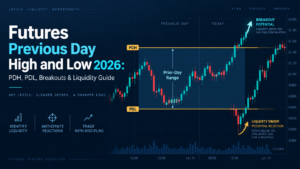
Futures Previous Day High and Low are two of the most practical reference levels for intraday futures trading. Previous Day High (PDH) marks the highest price reached during the prior defined session, while Previous Day Low (PDL) marks the lowest. Together they define the prior-day range and create objective boundaries that can be tested, broken, swept, rejected or accepted during the next session. Their value does not come from a rule that PDH must act as resistance or PDL must act as support. The useful information comes from how current price behaves when it reaches a level where the previous session stopped extending.
Quick Answer
Futures Previous Day High and Low are the high and low of the previous trading session, commonly abbreviated PDH and PDL. For the ES/MES examples in this guide, TradeboticsAI uses the previous U.S. regular trading session as the primary definition, while clearly separating it from the full Globex/ETH session. A clean break above PDH or below PDL becomes more meaningful when price builds acceptance beyond the level. A brief break followed by a fast reclaim can indicate rejection, a liquidity sweep or trapped breakout traders. Session definition must remain consistent when testing these levels.
Explore NinjaTrader for futures charting, order-flow tools and simulated PDH/PDL analysis
Affiliate Disclosure: TradeboticsAI may earn compensation when an eligible user completes a qualifying action through an affiliate link, at no additional cost to the user. Affiliate relationships do not determine our editorial conclusions.
What Are Futures Previous Day High and Low?
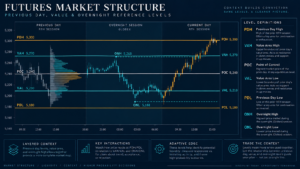
Futures Previous Day High and Low are the maximum and minimum prices reached during a previously defined futures trading session. PDH means Previous Day High; PDL means Previous Day Low.
The definition sounds simple, but session selection matters. Futures trade electronically for most of the day, so the previous “day” can mean the prior regular trading-hours session, the prior full Globex session or a custom session template.
For the TradeboticsAI ES/MES intraday framework on this page:
- PDH: highest price of the prior U.S. regular trading session.
- PDL: lowest price of the prior U.S. regular trading session.
- PDM: midpoint between PDH and PDL.
- Previous Day Range: PDH minus PDL.
This convention is chosen because it separates yesterday’s main U.S. auction from the current overnight Globex session. It is a trader methodology, not a CME indicator.
NinjaTrader’s Trading Hours Templates define the session start and end times applied to a data series, which is important because changing the session template can change the previous session’s high and low.
Futures Previous Day High and Low: RTH vs ETH
The most common source of PDH/PDL errors is mixing regular-session and extended-session definitions.
For U.S. equity-index futures, one trader may mark the high and low from the prior U.S. cash-session window, while another may use the entire nearly 24-hour Globex session. Both are valid research choices, but they are not the same levels.
CME equity-index futures trade electronically for most of the business day. The extended session therefore contains overnight prices that are excluded from an RTH-only PDH/PDL calculation.
CME Group E-mini S&P 500 product page
| Definition | What It Includes | Best Use |
|---|---|---|
| RTH PDH/PDL | Prior U.S. regular-session range | Intraday open, prior-value and cash-session structure |
| ETH / Full-Session High-Low | Prior electronic futures session including overnight trade | Full-session context and broader range analysis |
Do not use an RTH PDH on Monday and an ETH PDH on Tuesday because one looks more attractive. Futures Previous Day High and Low become useful research variables only when the session template stays fixed.
How to Calculate Futures Previous Day High and Low
The calculations are straightforward once the session is defined.
PDH = Maximum price of the previous defined session
PDL = Minimum price of the previous defined session
Prior-Day Range = PDH − PDL
Prior-Day Midpoint = (PDH + PDL) ÷ 2
Assume the prior ES regular session records:
- PDH: 6,205.50
- PDL: 6,160.25
The previous-day range is 45.25 ES points, and the midpoint is 6,182.875. Because ES trades in 0.25-point increments, a charting implementation should handle midpoint display according to the platform’s tick-rounding convention.
The PDH and PDL remain fixed throughout the next session. New intraday highs or lows do not move yesterday’s reference.
Why Futures Previous Day High and Low Matter
Futures Previous Day High and Low matter because they are visible, objective boundaries from a completed auction. Traders can independently calculate the same levels when they use the same session definition.
They also answer a useful market-structure question. Yesterday’s session could not sustain trade beyond PDH or PDL. When today’s auction returns to one of those prices, participants must decide whether the old boundary still represents rejection or whether new information justifies acceptance beyond it.
Three common outcomes are:
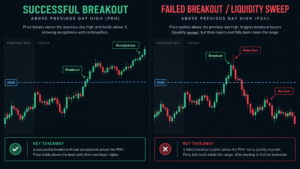
- Rejection: price tests the level and returns toward the prior range.
- Breakout + acceptance: price crosses the level and begins building trade beyond it.
- Failed breakout: price crosses the level, attracts breakout participation and then reclaims the previous range.
The level is not the signal. The current auction response is the information that matters.
The Three-Zone Futures Previous Day High and Low Map
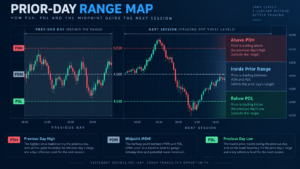
A useful way to simplify Futures Previous Day High and Low is to divide the chart into three zones.
| Zone | Location | Auction Question |
|---|---|---|
| Above PDH | Outside prior range | Are higher prices being accepted? |
| Inside Prior Range | Between PDH and PDL | Is the market rotating toward value or another boundary? |
| Below PDL | Outside prior range | Are lower prices being accepted? |
This map prevents the common mistake of treating PDH and PDL only as reversal levels. A market spending meaningful time above PDH is communicating something different from a market that briefly sweeps PDH and falls immediately back inside yesterday’s range.
Futures Previous Day High and Low Breakouts
A PDH breakout occurs when current price trades above the previous regular-session high. A PDL breakdown occurs when price trades below the previous low.
A stronger break above PDH can include:
- price trades clearly through PDH rather than only one tick above it;
- aggressive buying produces additional upward progress;
- pullbacks hold near or above the old high;
- time and volume begin developing outside the prior range;
- Initial Balance or developing value supports the new area;
- the market does not immediately rotate back toward prior value.
The same logic applies to a downside break through PDL.
For Futures Previous Day High and Low, acceptance is the key distinction. The previous day’s extreme tells you where the old auction ended; the new auction must prove whether it can conduct business beyond that boundary.
Failed Futures Previous Day High and Low Breakouts
A failed breakout is often more informative than a simple first-touch rejection because real trading occurs beyond the level before the auction reverses.
Example at PDH:
- ES rallies toward PDH.
- Price trades several ticks above the old high.
- Breakout buying accelerates.
- Positive delta increases but price stops progressing.
- ES drops back below PDH.
- A retest from underneath cannot reclaim the level.
The sequence can indicate a failed auction above the previous range. Recent breakout buyers may now be poorly positioned.
A PDL failure is the inverse: price breaks the previous low, selling accelerates, downside progress fails and the market reclaims PDL.
This is where Futures Previous Day High and Low connects with Futures Liquidity Sweep 2026 and Futures Trapped Traders 2026.
Opening Inside vs Outside Futures Previous Day High and Low
Where the regular session opens relative to Futures Previous Day High and Low changes the entire opening question.
| Opening Location | Primary Question |
|---|---|
| Inside Prior Range | Will price rotate toward PDH, PDL or prior value? |
| Above PDH | Will the market accept the extension or return into yesterday’s range? |
| Below PDL | Will lower prices be accepted or rejected back into the previous range? |
An open outside yesterday’s range deserves special attention because the market begins the primary session in territory the prior RTH auction never reached. Returning inside the range is different from maintaining acceptance outside it.
Futures Previous Day High and Low With ONH and ONL
Futures Overnight High and Low 2026 adds the current pre-market boundaries to yesterday’s RTH boundaries.
Several useful relationships can appear:
- ONH below PDH: the overnight auction has not yet tested yesterday’s high.
- ONH above PDH: overnight price already traded through yesterday’s high before RTH opened.
- ONL above PDL: the previous-day low remains untouched overnight.
- ONL below PDL: overnight trade already explored below the prior RTH low.
When ONH and PDH cluster tightly, the zone can attract additional attention because two independently defined boundaries overlap. The same applies to ONL and PDL.
Do not assume confluence guarantees a reaction. If the new auction accepts through both references, the cluster can become evidence of strong price discovery rather than resistance or support.
Futures Previous Day High and Low With VAH, VAL and POC
PDH and PDL define the outer range; Value Area High, Value Area Low and Point of Control describe where the previous session conducted more of its business.
That creates a richer market map:
- PDH: previous upper range boundary.
- VAH: upper boundary of the prior value area.
- POC: key prior-session value reference.
- VAL: lower boundary of prior value.
- PDL: previous lower range boundary.
A session opening above PDH is already above the entire previous RTH range. A session opening above VAH but below PDH is outside prior value while still inside yesterday’s range. Those conditions should not be treated identically.
Use Futures Volume Profile 2026 and Futures Auction Market Theory 2026 for the broader acceptance framework.
Futures Previous Day High and Low With Opening Types
Futures Opening Types 2026 describes how the regular session behaves after opening around these reference levels.
Examples include:
- Open Drive above PDH: potential acceptance if price continues away from the previous range.
- Open Test Drive at PDL: lower prices are tested, rejected and followed by a directional move higher.
- Open Rejection Reverse above PDH: the session probes higher territory before reversing through the opening area.
- Open Auction inside prior range: PDH and PDL remain outer references while the market searches for direction.
The opening type explains behavior; Futures Previous Day High and Low explain location. Combining the two is more useful than using either alone.
Futures Previous Day High and Low With Initial Balance
Initial Balance helps determine whether an early PDH/PDL event survives beyond the first minutes of the session.
If ES opens above PDH and the entire Initial Balance develops above yesterday’s high, that is stronger acceptance evidence than a brief opening spike followed by rotation back inside the prior range.
If price breaks PDL but Initial Balance later reclaims the old range and develops above PDL, the downside break has failed to create durable acceptance.
See Futures Initial Balance Trading 2026 for IB High, IB Low, width and range-extension methodology.
Order Flow Confirmation for Futures Previous Day High and Low
Order flow is most useful when price is actively testing one of the levels. A footprint in the middle of yesterday’s range may add little information if no meaningful auction decision is taking place.
Footprint Charts
Footprints can show whether aggressive buyers above PDH are producing progress or being absorbed.
Volume Delta
Futures Volume Delta 2026 helps compare aggressive effort with price response. Strong positive delta above PDH without upward progress is different from strong delta that builds acceptance.
Stacked Imbalance
Futures Stacked Imbalance 2026 can show repeated aggression across a PDH or PDL break. The signal still requires successful price progress.
Time & Sales
Tape can show whether activity accelerates through the level or whether the break loses participation quickly.
Absorption
Futures Absorption Trading 2026 becomes relevant when large aggressive volume appears at PDH or PDL but fails to move price through the boundary.
Explore NinjaTrader Order Flow+ and practice PDH/PDL breakouts and failed breaks in simulation
TradeboticsAI Futures Previous Day High and Low Framework
TradeboticsAI uses six layers to evaluate Futures Previous Day High and Low without turning PDH or PDL into automatic entry signals.
| Layer | Question | Evidence |
|---|---|---|
| 1. Session Definition | Which prior session created PDH/PDL? | Fixed RTH or ETH template |
| 2. Opening Location | Where does RTH open? | Inside range, above PDH or below PDL |
| 3. Nearby Context | What else overlaps the level? | ONH/ONL, VAH/VAL, POC, weekly levels |
| 4. Interaction | Break, reject, sweep or rotate? | Price action around PDH/PDL |
| 5. Acceptance | Is the market doing business beyond the range? | Time, volume, value migration, Initial Balance |
| 6. Risk | What proves the thesis wrong? | Failed reclaim, failed retest or opposite acceptance |
The framework creates four practical states:
- PDH break + acceptance: upside price discovery.
- PDH break + rejection: possible failed breakout or trapped buyers.
- PDL break + acceptance: downside price discovery.
- PDL break + rejection: possible failed breakdown or trapped shorts.
The logic is deliberately similar to ONH/ONL analysis because both are auction boundaries. The difference is the session that created each reference.
Practical Futures Previous Day High and Low Examples: ES
Example 1: PDH Break and Acceptance
Assume prior RTH PDH is 6,205.50 and PDL is 6,160.25. The current overnight session holds below PDH, and RTH opens at 6,198.00.
ES trades through 6,205.50 shortly after the open. Buyers continue lifting offers, the first pullback holds above 6,205.50 and volume begins developing around 6,208–6,212.
This is a stronger bullish Futures Previous Day High and Low scenario because price has not only crossed PDH; it has begun accepting above the previous range.
Example 2: PDH Sweep and Reversal
ES trades above 6,205.50 to 6,207.25. Positive delta expands, but price cannot continue. Sellers push ES back under PDH and a retest from below fails.
The move can now be analyzed as a failed breakout or liquidity sweep rather than successful upside discovery.
Example 3: PDL Break and Acceptance
ES approaches 6,160.25 from above, trades through the prior low and continues lower. Pullbacks remain below PDL, negative delta produces additional progress and the developing POC moves beneath the previous range.
PDL has transitioned from historical boundary to accepted territory.
Example 4: PDL Failed Breakdown
ES prints 6,158.75 below PDL but cannot extend. Heavy sell volume is absorbed, price reclaims 6,160.25 and then rotates toward prior value.
The old low has been tested and rejected by the new auction. That does not guarantee a full reversal to PDH, but it invalidates the simple breakdown thesis.
Example 5: RTH Opens Above PDH
Overnight news pushes ES above the previous range and RTH opens at 6,214.00. The correct question is not whether PDH must be filled. It is whether price can continue conducting business above yesterday’s high.
If an early selloff tests PDH and holds, the old boundary can become a reference beneath the new auction. If price returns decisively inside yesterday’s range, the overnight repricing is being challenged.
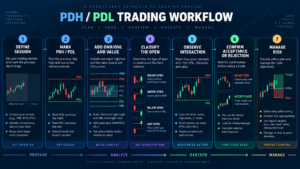
Practical Futures Previous Day High and Low Trading Workflow
- Choose the session definition. Decide whether PDH/PDL come from RTH or the full electronic session.
- Use the active futures contract. Avoid building levels from an expiration that has already lost liquidity after rollover.
- Mark PDH, PDL and the prior-day midpoint.
- Add prior VAH, VAL and POC.
- Add ONH and ONL. This shows whether overnight trade already tested the prior-day boundaries.
- Classify the RTH opening location. Inside, above or below the previous range.
- Wait for interaction. Do not predict a PDH or PDL reaction before price arrives.
- Separate break from acceptance. A one-tick violation is not enough.
- Use order flow selectively. Confirm whether aggression succeeds or fails around the level.
- Let Initial Balance update the thesis.
- Define invalidation before entry.
- Record outcomes. Track untouched, rejected, swept and accepted levels separately.
Over time, a journal can answer useful questions such as whether the first PDH/PDL test differs from later tests, whether ONH/ONL confluence improves outcomes and how gap location affects successful acceptance.
Common Futures Previous Day High and Low Mistakes
1. Mixing RTH and ETH Levels
The same contract can have different prior highs and lows depending on the Trading Hours template. Define the session before testing.
2. Treating PDH as Automatic Resistance
Price can accept above PDH and continue higher. The level is a boundary, not a guaranteed ceiling.
3. Treating PDL as Automatic Support
Price can accept beneath PDL and continue lower. The previous low is not a guaranteed floor.
4. Trading the First Tick Through a Level
Crossing PDH or PDL is only a break. Acceptance requires additional evidence.
5. Calling Every Break a Liquidity Sweep
A genuine breakout can continue. A sweep thesis requires failure and return through the level.
6. Ignoring the Overnight Auction
ONH, ONL and overnight inventory can show whether the previous range was already challenged before RTH opened.
7. Ignoring Prior Value
Opening above VAH but below PDH is different from opening above the entire previous range.
8. Assuming a Failed PDH Break Must Reach PDL
Failed acceptance above one boundary does not guarantee traversal of the entire prior range.
9. Using Historical Levels After They Become Stale
The previous day’s levels are most directly tied to the immediately preceding session. Older highs/lows may still matter but belong to a different framework.
10. Ignoring Risk and Slippage
Economic releases can drive futures through PDH or PDL rapidly. Reference levels do not protect against poor execution.
Pros and Limitations of Futures Previous Day High and Low
Pros
- Objective once the session is defined.
- Known before the new RTH session begins.
- Useful for breakouts, rejections and failed auctions.
- Combines naturally with prior value and overnight levels.
- Works with simple price charts or advanced order flow.
- Can be converted into clean backtest variables.
Limitations
- RTH and ETH definitions can produce different levels.
- PDH/PDL do not guarantee reactions.
- Breakouts can fail rapidly.
- Strong news can overwhelm historical references.
- Order-flow confirmation remains probabilistic.
- Execution costs matter for frequent intraday trading.
Best For
Futures Previous Day High and Low are most useful for intraday ES, MES, NQ and MNQ traders who build a pre-market map and then evaluate acceptance or rejection at objective session boundaries.
Not Ideal For
They are less useful for traders seeking automatic first-touch signals or anyone who changes session definitions after seeing the chart.
Futures Previous Day High and Low FAQ
What are Futures Previous Day High and Low?
Futures Previous Day High and Low are the highest and lowest prices from a defined previous futures session. They are commonly abbreviated PDH and PDL.
What does PDH mean in futures?
PDH means Previous Day High.
What does PDL mean in futures?
PDL means Previous Day Low.
Should PDH and PDL use RTH or ETH?
Either can be used, but the choice must be explicit and consistent. This page uses prior RTH levels for the main ES/MES examples and treats full-session highs/lows separately.
Are PDH and PDL official CME indicators?
No. They are trader-calculated reference levels based on a chosen session definition.
How do you calculate the prior-day range?
Subtract PDL from PDH. The midpoint is calculated as (PDH + PDL) ÷ 2.
Is PDH resistance?
PDH can become a reaction level, but it is not guaranteed resistance. Acceptance above PDH can support continuation.
Is PDL support?
PDL can become a reaction level, but acceptance beneath it can support continued downside price discovery.
What is a PDH liquidity sweep?
It generally describes price trading above PDH and then failing back below it. A real sweep thesis requires rejection, not just a small breakout.
What is a PDL liquidity sweep?
It describes price trading below the previous low and then reclaiming the prior range.
How do PDH/PDL differ from ONH/ONL?
PDH and PDL come from the previous defined session. ONH and ONL come from the current overnight session before RTH opens.
Can the overnight high be above PDH?
Yes. Overnight futures can trade beyond the previous RTH high before the next cash-session open.
Can Initial Balance confirm a PDH breakout?
Yes. Initial Balance developing above PDH provides stronger evidence of acceptance than an early spike that falls back inside the prior range.
Can Volume Delta confirm Futures Previous Day High and Low?
Delta can show aggressive participation, but the critical question is whether the aggression creates price progress and acceptance.
Do PDH and PDL predict which side will break first?
No. Futures Previous Day High and Low define boundaries. Current-session order flow, opening location, news and value development determine how those boundaries are used.
Do PDH and PDL work on NQ and MNQ?
The framework applies to NQ and MNQ, but volatility and range behavior differ from ES/MES and should be researched separately.
Final Verdict: How to Use Futures Previous Day High and Low Correctly
Futures Previous Day High and Low belong on a disciplined intraday map because they are fixed, objective and known before the next regular session begins.
The mistake is assuming that yesterday’s high must reject price or yesterday’s low must support it.
The stronger TradeboticsAI process is:
define the session → mark PDH/PDL → add prior value and ONH/ONL → classify the RTH open → observe the test → distinguish break from acceptance → confirm rejection or continuation → manage risk.
PDH can become a successful upside breakout, a failed auction or simply an untouched reference. PDL can become accepted downside territory, a failed breakdown or a level that never enters the session’s decision process.
Use Futures Previous Day High and Low alongside Overnight High and Low, Overnight Inventory, Opening Types, Initial Balance Trading, Volume Profile, Volume Delta and Order Flow Trading.
The objective is not to predict a reversal because price reached an old high or low. It is to arrive prepared with the prior auction boundaries already defined and let the current market prove whether those boundaries are still being rejected or are becoming accepted.
Explore NinjaTrader for futures charting, order-flow analysis and simulated PDH/PDL trading
Affiliate Disclosure: TradeboticsAI may receive compensation when eligible users complete a qualifying action through certain affiliate links. Affiliate relationships do not determine our editorial conclusions.
Risk Disclosure: Futures trading involves substantial risk of loss and is not suitable for every investor. Previous-day highs/lows, prior value, overnight levels, Volume Delta, footprint charts and historical breakout behavior do not predict future returns. PDH and PDL can fail without warning, macroeconomic releases can create rapid repricing and slippage, and simulated results do not guarantee future live performance. Nothing on this page is personalized investment, financial, tax or trading advice.