Futures Overnight High and Low 2026: ONH, ONL, Breakouts & Reversals Guide
Futures Overnight High and Low are two of the simplest but most useful reference levels for intraday index-futures traders. The Overnight High (ONH) marks the highest price reached before the U.S. regular trading session, while the Overnight Low (ONL) marks the lowest. Together they define the overnight range and show where the Globex auction reached its outer boundaries before the RTH open. These levels are not automatic support or resistance. Their real value comes from observing what happens when regular-session liquidity tests, accepts, rejects, sweeps or breaks those previously established extremes.
Quick Answer
Futures Overnight High and Low identify the highest and lowest prices formed during the overnight futures session. For the ES/MES examples in this guide, TradeboticsAI defines the overnight window as 6:00 p.m. ET through the 9:30 a.m. ET U.S. cash-market open. Traders use ONH and ONL as pre-defined auction boundaries. A break that holds beyond an overnight extreme can support continuation; a sweep that quickly returns inside the overnight range can indicate rejection, trapped breakout traders or a failed auction. Always define the session consistently before testing the setup.
Explore NinjaTrader for overnight-session charting, order flow and futures simulation
Affiliate Disclosure: TradeboticsAI may earn compensation when an eligible user completes a qualifying action through an affiliate link, at no additional cost to the user. Affiliate relationships do not determine our editorial conclusions.
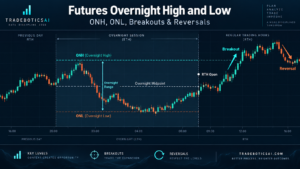
What Are Futures Overnight High and Low?
Futures Overnight High and Low are the highest and lowest transaction prices reached during a defined overnight or extended-hours futures session. They are commonly abbreviated ONH and ONL.
For U.S. equity-index futures, the contracts trade electronically for nearly the full business day. CME currently lists E-mini S&P 500 futures as trading Sunday through Friday from 5:00 p.m. to 4:00 p.m. Central Time, which corresponds to 6:00 p.m. to 5:00 p.m. Eastern Time.
CME Group E-mini S&P 500 Product Overview
For this TradeboticsAI methodology, the ES/MES overnight range starts with the new Globex session at 6:00 p.m. ET and ends immediately before the 9:30 a.m. ET U.S. cash-market open.
That gives four objective references:
- ONH: highest overnight price;
- ONL: lowest overnight price;
- ON Mid: midpoint between ONH and ONL;
- ON Range: distance between ONH and ONL.
The purpose of Futures Overnight High and Low is not to predict direction before RTH opens. The levels create a map showing where overnight price discovery stopped in both directions.
How to Define the Futures Overnight High and Low Session
A consistent session definition is mandatory. Two traders can calculate different Futures Overnight High and Low values if one begins the overnight window at 6:00 p.m. ET while another uses a different futures-session template.
For the TradeboticsAI ES/MES framework:
Overnight session: 6:00 p.m. ET → 9:30 a.m. ET.
Regular-session analysis begins: 9:30 a.m. ET.
This is a research convention designed to separate the Globex overnight auction from the primary U.S. cash-session opening process. It should not be presented as an exchange-defined indicator named ONH or ONL.
NinjaTrader allows trading-hour templates to contain explicit session start and end definitions, which is useful when building repeatable ONH/ONL indicators or strategies.
NinjaTrader Trading Hours Sessions Documentation
Do not change the session window because a different definition makes a historical setup look better. If Futures Overnight High and Low are going to become backtest variables, the timezone and overnight window need to remain fixed.
How to Calculate Futures Overnight High and Low
The calculation is straightforward.
ONH = Maximum price traded during the defined overnight session
ONL = Minimum price traded during the defined overnight session
Overnight Range = ONH − ONL
Overnight Midpoint = (ONH + ONL) ÷ 2
Assume ES records:
- ONH: 6,140.25
- ONL: 6,096.75
The overnight range is:
6,140.25 − 6,096.75 = 43.50 ES points.
The midpoint is:
(6,140.25 + 6,096.75) ÷ 2 = 6,118.50.
This creates an objective pre-market map. Futures Overnight High and Low then remain fixed for the RTH session rather than moving every time price establishes a new regular-session high or low.
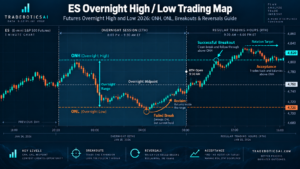
Why Futures Overnight High and Low Matter
Futures Overnight High and Low are useful because they were formed before the largest U.S. equity-session participation window begins. When RTH reaches one of those levels, the market is revisiting a price where the overnight auction previously stopped extending.
That creates a clear auction question:
Will regular-session participants accept price beyond the overnight extreme, or reject it back into the overnight range?
The level itself does not answer that question.
Three common outcomes are:
- Break and acceptance: price moves beyond ONH or ONL and establishes trade outside the overnight range.
- Sweep and rejection: price briefly trades through the extreme before returning inside.
- Rotation: price remains inside the overnight range and neither boundary becomes decisive.
This framework makes Futures Overnight High and Low especially compatible with Auction Market Theory. The focus remains acceptance versus rejection rather than assuming every visible horizontal line is support or resistance.
Futures Overnight High and Low and Overnight Range Width
The distance between Futures Overnight High and Low also provides volatility context. A narrow overnight range and a very wide overnight range should not automatically be traded the same way.
TradeboticsAI uses a relative-width approach:
Relative Overnight Range = Current Overnight Range ÷ Median Overnight Range of Recent Comparable Sessions
Suppose today’s ES overnight range is 30 points and the median of the previous 20 comparable sessions is 40 points.
Relative Overnight Range = 30 ÷ 40 = 0.75.
The overnight auction is relatively compressed compared with the recent sample.
If today’s range is 60 points against the same 40-point median:
60 ÷ 40 = 1.50.
The overnight range is relatively expanded.
This does not mean a narrow overnight range must break or a wide one must reverse. It simply prevents Futures Overnight High and Low analysis from relying on obsolete fixed-point thresholds as volatility regimes change.
Futures Overnight High and Low Breakouts
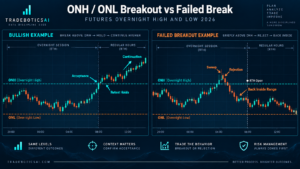
A breakout occurs when RTH price trades beyond ONH or ONL. But crossing an overnight extreme by one tick is not enough to prove that the auction has accepted the breakout.
A stronger bullish break above ONH can include:
- price trades clearly above the overnight high;
- aggressive buying produces additional progress;
- pullbacks fail to return deeply into the overnight range;
- volume starts developing above ONH;
- Initial Balance forms partly or entirely above the overnight range;
- value begins migrating higher.
A bearish ONL breakout uses the same logic in reverse.
The important principle for Futures Overnight High and Low is:
Breakout + acceptance is different from breakout + immediate rejection.
Once price begins building time and volume beyond an overnight extreme, repeatedly fading the level simply because it was yesterday’s ONH or ONL can become expensive.
Failed Futures Overnight High and Low Breakouts
A failed breakout develops when price trades beyond ONH or ONL but cannot sustain the new territory.
Consider an ONH failure:
- ES approaches ONH from below;
- price trades several ticks above ONH;
- breakout buyers become active;
- positive delta expands;
- price stops making progress;
- ES falls back below ONH;
- a retest from underneath fails.
This can create a higher-quality rejection setup because traders actually participated beyond the overnight boundary before the market returned inside.
A failed ONL break is the mirror image and can leave recent shorts vulnerable.
This is where Futures Overnight High and Low connects directly with Futures Liquidity Sweep 2026 and Futures Trapped Traders 2026.
Do not call every break a liquidity sweep. The important confirmation is failure and reclaim of the overnight range.
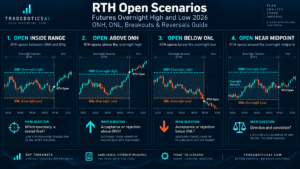
Futures Overnight High and Low: RTH Open Inside vs Outside the Range
Where RTH opens relative to Futures Overnight High and Low changes the opening question.
| RTH Opening Location | Primary Question |
|---|---|
| Inside Overnight Range | Which overnight boundary will attract the first meaningful test? |
| Above ONH | Will higher prices be accepted, or will price fall back into the overnight range? |
| Below ONL | Will lower prices be accepted, or will price reclaim the overnight range? |
| Near Overnight Mid | Is the session initially balanced with both extremes still available? |
An open beyond ONH or ONL is especially important because price has already left the overnight auction before the primary session begins. Do not assume it must immediately fill back toward the overnight midpoint.
Acceptance outside Futures Overnight High and Low can be evidence of genuine repricing, particularly when it also occurs outside prior-day value.
Futures Overnight High and Low With Overnight Inventory
The recently completed Futures Overnight Inventory 2026 guide adds another layer.
Suppose overnight inventory is strongly long and ES opens close to ONH. There are two very different outcomes:
ONH rejects: buyers fail above the overnight high, price returns inside the range and begins correcting the long inventory.
ONH accepts: price breaks the overnight high, holds above it and value develops higher. The fact that inventory was already long did not force a correction.
Similarly, short inventory approaching ONL can either correct upward or continue lower if RTH accepts below the overnight range.
Futures Overnight High and Low therefore provide precise boundaries for evaluating whether overnight inventory is being defended, corrected or extended.
Futures Overnight High and Low With Opening Types
Futures Opening Types 2026 can dramatically improve ONH/ONL context.
Examples include:
- Open Drive through ONH: potential upside acceptance if price does not return into the overnight range.
- Open Test Drive at ONL: price tests the overnight low, rejects it and drives higher.
- Open Rejection Reverse above ONH: initial upside auction fails and reverses back through the opening area.
- Open Auction inside ON range: neither overnight extreme initially controls the auction.
The advantage is sequence. Futures Overnight High and Low identify the location; Opening Types describe the behavior that develops around or away from that location.
Futures Overnight High and Low With Initial Balance
Initial Balance helps determine whether an ONH or ONL event survived beyond the opening minutes.
Consider an upside break through ONH. If the completed Initial Balance forms almost entirely above ONH and subsequent pullbacks hold the old overnight high, the new auction is showing stronger acceptance.
If price breaks ONH but Initial Balance later develops back inside the overnight range, the original breakout is much less convincing.
Use Futures Initial Balance Trading 2026 for IB High, IB Low, relative width and range-extension methodology.
The complete Futures Overnight High and Low sequence becomes:
overnight extreme → RTH test → opening response → Initial Balance → acceptance/rejection → range extension.
Order Flow Confirmation for Futures Overnight High and Low
Order flow becomes useful when price is actually interacting with ONH or ONL. There is little reason to stare at footprint details when price is in the middle of the overnight range and no decision is occurring.
Footprint Charts
A footprint can show whether buyers aggressively lift offers above ONH and whether that aggression produces real progress. Heavy buying with no progress can indicate absorption.
Volume Delta
Futures Volume Delta 2026 can confirm aggressive participation. Positive delta above ONH is continuation evidence only if higher prices remain accepted.
Stacked Imbalance
A Futures Stacked Imbalance through an overnight boundary can show repeated directional aggression. A stack that immediately fails back into the range can instead highlight trapped traders.
Time & Sales
Tape can help show whether transaction activity accelerates through an overnight level or whether participation dries up after the initial probe.
Cumulative Delta
CVD can provide session-level context for whether broader aggressive pressure supports or diverges from the ONH/ONL test.
The goal of order-flow analysis is to determine whether Futures Overnight High and Low are being crossed efficiently, rejected or absorbed—not to create another indicator that overrides price.
Explore NinjaTrader Order Flow+ and practice ONH/ONL breakouts and reversals in simulation
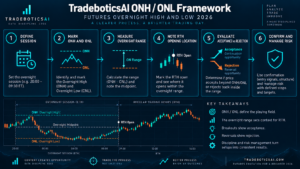
TradeboticsAI Futures Overnight High and Low Framework
TradeboticsAI uses six layers to evaluate Futures Overnight High and Low without treating either level as an automatic entry.
| Layer | Question | Evidence |
|---|---|---|
| 1. Session Definition | Were ONH and ONL calculated consistently? | Fixed timezone and overnight window |
| 2. Range Context | Is the overnight range relatively narrow or wide? | Recent median or percentile comparison |
| 3. Opening Location | Where does RTH begin? | Inside range, above ONH or below ONL |
| 4. Level Interaction | Break, sweep, reject or rotate? | Price response around ONH/ONL |
| 5. Acceptance | Is business developing beyond the extreme? | Time, volume, IB and value migration |
| 6. Invalidation | What proves the thesis wrong? | Failed reclaim, failed retest or opposite acceptance |
The framework produces four practical states:
- ONH break + acceptance: upside price discovery.
- ONH break + rejection: possible failed breakout or trapped buyers.
- ONL break + acceptance: downside price discovery.
- ONL break + rejection: possible failed breakdown or trapped shorts.
This is the core of Futures Overnight High and Low analysis: the level creates the test; the auction response creates the information.
Practical Futures Overnight High and Low Examples: ES
Example 1: ONH Break and Acceptance
Assume ES records ONH at 6,140.25 and ONL at 6,096.75. RTH opens at 6,134.00.
Buyers push through 6,140.25 shortly after the open. Ask-side volume increases, price reaches 6,145.00 and the first pullback holds around 6,141.00.
Initial Balance later develops primarily above ONH and the developing POC moves higher.
This is a stronger bullish Futures Overnight High and Low scenario because the market did more than touch the overnight high: it accepted beyond it.
Example 2: ONH Sweep and Reversal
Use the same ONH at 6,140.25. ES trades to 6,142.00 with strong positive delta but immediately stalls.
Price falls below ONH, returns to 6,136.00 and a retest of 6,140.25 from underneath fails.
The breakout buyers are now vulnerable. The setup can overlap with liquidity-sweep and trapped-trader analysis.
Example 3: ONL Break and Acceptance
ES opens near 6,103.00 and quickly trades below ONL at 6,096.75. Selling remains effective, price holds below the level and new volume develops at 6,092–6,095.
The old overnight low has transitioned from boundary to accepted territory.
Example 4: ONL Failed Breakdown
ES prints 6,095.50 below ONL but negative delta fails to create additional downside progress. Buyers reclaim 6,096.75 and then push through 6,101.00.
The overnight low was tested, briefly broken and rejected. This is a potential failed breakdown rather than bearish acceptance.
These examples show why Futures Overnight High and Low should be evaluated from the full auction sequence rather than from a first touch alone.
Data, Platform and Hidden Costs
The basic Futures Overnight High and Low calculation requires only reliable extended-hours futures data. More advanced confirmation can involve additional costs.
| Cost Area | Why It Matters |
|---|---|
| Exchange Data | Real-time CME futures data may require exchange/data-provider fees. |
| Historical Tick Data | Required for detailed footprint and accurate order-flow replay. |
| Order-Flow Features | Volumetric Bars, CVD or advanced depth tools can depend on platform access. |
| Commissions & Fees | Frequent breakout/reversal trading increases round-trip costs. |
| Slippage | ONH/ONL breaks around major news can move faster than expected. |
Verify current data plans and platform pricing directly before purchasing a service specifically for this methodology.
Practical Futures Overnight High and Low Trading Workflow
- Use the active contract. Ensure ES, NQ, MES or MNQ has rolled to the contract with relevant liquidity.
- Define one overnight session. Keep timezone and start/end times fixed.
- Mark ONH, ONL and overnight midpoint.
- Measure overnight range width. Compare it with recent comparable sessions.
- Add overnight inventory context. Determine whether activity was long, short or balanced.
- Mark prior VAH, VAL, POC, high and low.
- Record RTH opening location. Inside, above or below the overnight range.
- Wait for the ONH/ONL interaction. Avoid predicting a breakout before price tests the level.
- Distinguish acceptance from rejection. Use price first, then order flow as confirmation.
- Let Initial Balance update the setup. An early break can still fail later.
- Define invalidation before entry. Avoid moving the risk point simply because the overnight level looked important.
- Record the outcome. Build statistics for successful breaks, failed breaks and untouched sessions.
A journal built around Futures Overnight High and Low can eventually answer useful questions such as whether ONH or ONL was tested first, how often the first break gained acceptance, how overnight range width affected outcomes and whether opening location improved the setup.
Common Futures Overnight High and Low Mistakes
1. Treating ONH and ONL as Automatic Support and Resistance
An overnight boundary can be accepted through immediately. Wait for the market response.
2. Changing the Overnight Window
Different session definitions produce different levels. Keep the methodology consistent.
3. Trading the First Tick Through the Level
A one-tick break proves only that the extreme was exceeded. It does not prove acceptance.
4. Fading Every Breakout
A successful ONH or ONL breakout can begin sustained price discovery. Do not assume every extreme exists to trap traders.
5. Chasing Every Breakout
Many overnight-boundary breaks fail. Wait for price progress, acceptance or a successful retest.
6. Ignoring Overnight Range Width
A compressed overnight auction and a historically huge overnight range provide different volatility context.
7. Ignoring Prior Value
Futures Overnight High and Low become more informative when combined with prior VAH, VAL, POC and range.
8. Ignoring Overnight Inventory
A heavily one-sided overnight auction can change the interpretation of an ONH or ONL test.
9. Assuming Order Flow Predicts the Break
Footprint and delta report transactions. They cannot guarantee future acceptance.
10. Ignoring News Risk
Economic releases can create rapid repricing through overnight boundaries with significant slippage.
Pros and Limitations of Futures Overnight High and Low
Pros
- Simple and objective once the session is defined.
- Creates pre-market levels before RTH begins.
- Works naturally with Auction Market Theory.
- Useful for breakout and failed-breakout analysis.
- Combines with overnight inventory and Initial Balance.
- Can be converted into clear backtest variables.
Limitations
- Session definitions can vary between traders.
- ONH and ONL do not guarantee reactions.
- Breakouts can fail rapidly.
- News can overwhelm historical references.
- Order-flow confirmation remains probabilistic.
- Execution costs matter for frequent intraday trading.
Best For
Futures Overnight High and Low are most useful for intraday ES, MES, NQ and MNQ traders who actively separate the overnight Globex auction from the U.S. regular-session opening process.
Not Ideal For
They are less useful for traders looking for automatic first-touch reversal signals or anyone using inconsistent extended-hours data and session definitions.
Futures Overnight High and Low FAQ
What are Futures Overnight High and Low?
Futures Overnight High and Low are the highest and lowest prices reached during a defined futures overnight session before the regular U.S. trading session begins.
What does ONH mean in futures?
ONH means Overnight High, the highest traded price during the chosen overnight session.
What does ONL mean in futures?
ONL means Overnight Low, the lowest traded price during the chosen overnight session.
What overnight session does TradeboticsAI use for ES?
For this methodology, TradeboticsAI uses 6:00 p.m. ET through 9:30 a.m. ET for ES/MES overnight analysis.
Are ONH and ONL official CME indicators?
No. CME publishes trading hours and exchange data, while ONH and ONL are trader-defined reference levels calculated from a chosen session window.
How do you calculate the overnight range?
Subtract ONL from ONH. The midpoint is calculated as (ONH + ONL) ÷ 2.
Is the Overnight High resistance?
It can become a reaction level, but it is not guaranteed resistance. Price can break above it and develop acceptance.
Is the Overnight Low support?
It can become a reaction level, but it is not guaranteed support. Price can accept below ONL and continue lower.
What is an ONH sweep?
An ONH sweep is commonly used to describe price briefly trading above the overnight high before returning below it. Confirmation requires actual rejection, not just a small break.
What is an ONL sweep?
An ONL sweep occurs when price trades beneath the overnight low and then reclaims the overnight range.
How do Futures Overnight High and Low interact with overnight inventory?
ONH and ONL provide the outer boundaries where traders can judge whether one-sided overnight positioning is extending or correcting.
Can Initial Balance confirm an ONH breakout?
Yes. An Initial Balance that develops and remains above ONH provides stronger acceptance evidence than an early breakout that later collapses back inside the overnight range.
Can Volume Delta confirm ONH or ONL?
Volume Delta can reveal aggressive participation, but price must confirm whether that aggression is effective or absorbed.
Should I trade the first touch of ONH or ONL?
Not automatically. A first touch can reject, break cleanly or produce no useful reaction. Wait for a predefined setup and risk rule.
Do ONH and ONL work on NQ and MNQ?
The same structural concept can be applied to NQ and MNQ, but volatility, range width and execution behavior differ from ES/MES and should be tested separately.
Can Futures Overnight High and Low predict the entire session?
No. Futures Overnight High and Low create pre-market reference levels. RTH participation, news, Initial Balance and value development determine how the session ultimately evolves.
Final Verdict: How to Use Futures Overnight High and Low Correctly
Futures Overnight High and Low are valuable precisely because they are simple. Before RTH begins, the trader already knows where the overnight auction stopped extending upward and downward.
The mistake is turning those boundaries into automatic reversal signals.
The stronger TradeboticsAI process is:
define overnight session → mark ONH/ONL → measure range → add overnight inventory → classify RTH open → observe level interaction → determine acceptance or rejection → confirm with Initial Balance/order flow → manage risk.
A breakout above ONH that builds value can support continued upside price discovery. A break above ONH that immediately fails can expose trapped buyers. A break below ONL can produce genuine bearish continuation, while a failed breakdown can create a reversal back through the overnight range.
Use Futures Overnight High and Low alongside Overnight Inventory, Opening Types, Initial Balance Trading, Auction Market Theory, Volume Delta, Liquidity Sweep and Order Flow Trading.
The objective is not to predict which overnight extreme must break. It is to arrive at the RTH open with objective boundaries already defined and let the market prove whether those prices are accepted or rejected.
Explore NinjaTrader for extended-hours futures charts, order-flow analysis and simulation
Affiliate Disclosure: TradeboticsAI may receive compensation when eligible users complete a qualifying action through certain affiliate links. Affiliate relationships do not determine our editorial conclusions.
Risk Disclosure: Futures trading involves substantial risk of loss and is not suitable for every investor. Overnight highs/lows, overnight range, Market Profile, Volume Delta, footprint charts and historical breakout behavior do not predict future returns. Overnight boundaries can fail without warning, economic releases can create rapid repricing and slippage, and simulated results do not guarantee future live performance. Nothing on this page is personalized investment, financial, tax or trading advice.