Futures Excess Highs and Lows 2026: TPO Tails, Rejection & Auction Guide
Futures Excess Highs and Lows are Market Profile / TPO structures that form when the auction reaches an extreme and quickly rejects prices there, leaving a thin tail at the top or bottom of the completed profile. A selling tail at the high represents rejection of higher prices; a buying tail at the low represents rejection of lower prices. Excess is the structural opposite of a poor high or poor low: excess shows clearer rejection, while a poor extreme stops without a convincing taper. The most useful approach is not to assume a tail will permanently hold, but to treat it as evidence of a previous auction rejection and then evaluate how price behaves on a future retest.
Quick Answer
Futures Excess Highs and Lows are TPO profile extremes where one or several consecutive single-print rows create a thin buying or selling tail. A buying tail forms at a session low after lower prices are rejected; a selling tail forms at a session high after higher prices are rejected. Current TPO platforms can use configurable minimum tail lengths, so there is no universal number of rows that every platform must require. The strongest analysis combines tail quality, profile location, closing position, prior value, Volume Profile and order-flow confirmation when the level is tested again.
Explore NinjaTrader for futures charting, footprint analysis and simulated auction-market trading
Affiliate Disclosure: TradeboticsAI may earn compensation when an eligible user completes a qualifying action through an affiliate link, at no additional cost to the user. Affiliate relationships do not determine our editorial conclusions.
What Are Futures Excess Highs and Lows?
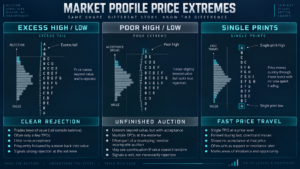
Futures Excess Highs and Lows describe auction extremes where price reached an outer boundary but did not remain there. Instead, the market moved away quickly enough to leave relatively thin TPO structure at the top or bottom of the profile.
Exocharts currently describes a TPO tail as a single print or short run of single prints at the very top or bottom of a session range, representing a rejection signature. Its current settings allow traders to configure minimum TPO requirements for buying and selling tails rather than assuming one universal definition.
A top tail is generally called a selling tail because higher prices encountered enough selling response to force the market lower.
A bottom tail is generally called a buying tail because lower prices encountered enough buying response to force the market higher.
These structures matter because TPO measures time spent at price. If the market spent little time at the extreme and then developed substantially more structure away from it, the profile records evidence that those extreme prices were not accepted during that session.
Useful reference:
Exocharts TPO Single Prints, Tails & Initial Balance documentation.
Futures Excess Highs and Lows: Buying Tail vs Selling Tail
| Structure | Profile Location | Auction Interpretation | Future Question |
|---|---|---|---|
| Buying Tail | Session/Profile low | Lower prices were rejected | Will buyers defend the rejected area on retest? |
| Selling Tail | Session/Profile high | Higher prices were rejected | Will sellers defend the rejected area on retest? |
A buying tail does not mean price can never trade below that low again. It means the completed auction contained evidence that lower prices were rejected during that profile.
The same applies to a selling tail. Futures Excess Highs and Lows create historical auction evidence, not permanent barriers.
How Futures Excess Highs and Lows Form
Imagine ES auctions lower throughout the morning. Sellers continue pressing bids until price reaches a region where buyers begin responding aggressively.
The sequence can be:
- price establishes new session lows;
- the market briefly explores those lower prices;
- responsive buying appears;
- price rapidly leaves the extreme;
- later TPO periods do not return to the lowest rows;
- a thin TPO tail remains beneath the wider body of the profile.
The completed structure is a potential buying tail.
A selling tail forms in reverse: price auctions higher, probes new highs, encounters rejection and then moves away while later periods remain below the extreme.
The important characteristic of Futures Excess Highs and Lows is not simply that the final candle has a wick. The TPO structure shows that the market spent comparatively little time at the extreme relative to the body of the auction.
Futures Excess Highs and Lows vs Poor Highs and Poor Lows
This is the most important distinction in the entire topic.
Futures Excess Highs and Lows show relatively clear auction rejection. Poor highs and poor lows show the opposite condition: an extreme where directional movement stopped without convincing rejection.
TradingView’s TPO documentation defines poor highs and poor lows as extreme levels containing more than one TPO block and specifically notes that they lack the characteristic taper associated with stronger reversal or rejection.
| Feature | Excess / Tail | Poor High / Poor Low |
|---|---|---|
| Extreme Shape | Thin, tapered | Flat or blunt |
| Time at Extreme | Limited | Multiple TPO periods interact with the extreme |
| Auction Read | Stronger rejection evidence | Auction appears less complete |
| Future Interpretation | Monitor whether rejection still holds | Monitor for further exploration / repair |
See Futures Poor Highs and Poor Lows 2026 for the complementary unfinished-auction framework.
TradingView reference:
TradingView TPO Indicator documentation.
Futures Excess Highs and Lows vs Single Prints
Both structures can contain one-TPO rows, but location separates them.
Futures Excess Highs and Lows occur at the final upper or lower extreme of a profile.
Futures Single Prints occur inside the body of the profile, away from the final profile extreme.
| Structure | Location | Primary Message |
|---|---|---|
| Excess Tail | Profile extreme | Rejection of extreme prices |
| Single Print Zone | Interior of profile | Fast traversal / low time acceptance |
Exocharts’ current TPO documentation makes the same conceptual distinction by separating single-print settings from buying-tail and selling-tail settings.
TPO Excess Tail vs Candlestick Wick
A TPO tail and a candle wick can visually describe similar price behavior, but they are not the same measurement.
A candlestick wick shows the distance between a bar’s extreme and its open/close/body.
A TPO tail shows how little time the market spent at the session/profile extreme across the chosen TPO brackets.
One long candlestick wick can occur during a profile that later revisits the same price repeatedly. In that case, the completed TPO structure may no longer show clean excess.
Conversely, Futures Excess Highs and Lows can become more obvious on a completed TPO profile even when no single candle contains an unusually dramatic wick.
The correct takeaway is:
Candlestick wick = bar-level rejection appearance.
TPO tail = time-at-price rejection structure.
What Makes Futures Excess Highs and Lows Stronger?
Not every tail carries equal information. Several contextual factors can strengthen or weaken Futures Excess Highs and Lows.
1. Tail Length
Several consecutive thin rows can show more structural rejection than a single isolated print, although the exact minimum required depends on platform settings and methodology.
2. Location
Excess forming at a meaningful reference can carry more contextual value than a random extreme.
Examples include:
- prior-day high or low;
- weekly high or low;
- prior Value Area High or Value Area Low;
- major composite profile boundary;
- important low-volume region;
- previous liquidity-sweep area.
3. Distance of the Close
If the market probes an extreme and later closes well away from it, the completed session provides stronger evidence that the auction did not accept those prices.
4. Volume Confirmation
Volume Profile can show whether the tail area also contains limited transaction volume or whether large activity occurred despite limited time.
5. Order-Flow Response
Footprint, delta and Time & Sales can help determine whether rejection involved absorption, exhaustion or a sudden change in aggressive participation.
Futures Excess Highs and Lows should therefore be evaluated as part of a multi-layer auction, not only as a visual TPO shape.
How to Trade a Retest of Futures Excess Highs and Lows
The retest is where historical Futures Excess Highs and Lows become especially useful.
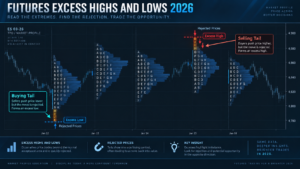
The old tail tells the trader that the previous auction rejected those prices. The new session determines whether that rejection remains valid.
Scenario 1: Tail Holds Again
Price approaches an old selling tail. Buyers trade aggressively toward the extreme but begin losing progress. Positive delta expands while price stalls, absorption appears and the market rotates lower.
The historical rejection has now received current-session confirmation.
Scenario 2: Tail Is Accepted Through
Price trades through the old selling tail and begins developing time and volume above it. Pullbacks hold above the former extreme and value migrates higher.
The previous rejection has failed. The market is now accepting prices the earlier session rejected.
Scenario 3: Liquidity Sweep Through the Tail
Price briefly breaks the old extreme, triggers additional transactions and immediately returns beneath it.
This can combine the historical tail with a Futures Liquidity Sweep setup, but the trader should still require rejection and reclaim rather than assuming every break is a stop run.
Futures Excess Highs and Lows: Rejection vs New Acceptance
The biggest conceptual error is treating historical excess as permanent.
A rejected price today can become accepted value tomorrow.
| Retest Behavior | Interpretation |
|---|---|
| Probe + rapid rejection | Previous excess remains relevant |
| Repeated failure at extreme | Responsive participation continues defending area |
| Time develops through tail | Historical rejection is weakening |
| New value builds beyond tail | Market has transitioned toward acceptance |
This acceptance-versus-rejection framework is central to Futures Auction Market Theory 2026.
Futures Excess Highs and Lows and Market Profile Day Types
Futures Excess Highs and Lows can also help interpret completed Market Profile day structures.
A balanced or Normal-style session may develop excess at both extremes as responsive buyers and sellers reject the edges of the auction.
A strong Trend Day may show relatively little opposing excess in the direction of the trend until the session eventually reaches a meaningful termination point.
A Neutral Day can create rejection at both sides after the market explores above and below Initial Balance.
A Double Distribution session can leave an excess tail at one outer extreme while single prints or thin structure separate the two accepted distributions.
For the complete classification framework, see Futures Market Profile Day Types 2026.
Excess should therefore be read as one structural component inside the larger profile rather than a separate market regime.
Order Flow Confirmation for Futures Excess Highs and Lows
TPO records where the auction rejected price historically. Order flow can help explain what participants are doing at the extreme or during a future retest.
Footprint Charts
A buying tail can be strengthened by evidence that heavy selling occurred near the low but failed to push price lower. That can indicate absorption.
See Futures Footprint Charts 2026.
Volume Delta
Futures Volume Delta can show whether aggressive buyers or sellers were effective. Extreme negative delta near a low becomes especially interesting when price refuses to continue lower.
Cumulative Delta
CVD can show whether the broader session’s aggressive flow agrees with the rejection or diverges from the final extreme.
Exhaustion
A tail can also form when the directional side simply runs out of participation rather than being absorbed by a very large passive order.
See Futures Exhaustion Trading 2026.
Stacked Imbalance
A Futures Stacked Imbalance near an extreme is useful only if the aggressive side actually achieves price progress. A buy stack at the high that fails can reinforce a selling-tail rejection thesis.
Explore NinjaTrader Order Flow+ tools and practice excess-tail retests in simulation
TradeboticsAI Futures Excess Highs and Lows Quality Framework
TradeboticsAI uses six layers to evaluate Futures Excess Highs and Lows. This prevents a thin-looking profile edge from becoming an automatic trading signal.
| Layer | Question | Higher-Quality Evidence |
|---|---|---|
| 1. TPO Structure | Is there a genuine tail? | Several thin extreme rows with clear taper |
| 2. Location | Where did the excess form? | Important prior or composite reference |
| 3. Distance From Close | Did the market remain away from the rejected extreme? | Session closes materially away from tail |
| 4. Order Flow | What caused the rejection? | Absorption, exhaustion or strong opposite response |
| 5. Retest | Does the level reject again? | Fresh rejection and failed acceptance |
| 6. Resolution | Has the old rejection been invalidated? | Clear acceptance or new value beyond tail |
This framework makes Futures Excess Highs and Lows measurable. Instead of saying “there is a tail, therefore reverse,” the trader tracks the quality of the original rejection and the response when that area becomes relevant again.

Practical Futures Excess Highs and Lows Example: ES Selling Tail
Assume ES rallies during the morning and reaches a prior weekly high at 6,540.00.
During the next TPO period, ES trades to 6,542.25 but cannot remain at the new extreme. Selling response appears and price rotates back toward 6,535.00.
Later TPO periods never revisit the top few rows.
The completed profile shows a thin selling tail between approximately 6,540.75 and 6,542.25.
TradeboticsAI records:
- meaningful higher-timeframe location;
- clear taper at the profile high;
- session acceptance developed below the tail;
- close occurred materially beneath the extreme.
Future Retest
Two sessions later, ES returns toward 6,542.25.
If buyers print strongly positive delta but cannot progress through the old tail and price quickly falls back below 6,540.75, the historical selling excess has received fresh confirmation.
If ES instead trades through 6,542.25, holds above it and begins building volume and TPO structure at 6,545–6,550, the old rejection has failed.
This example shows why Futures Excess Highs and Lows should not be traded mechanically. The tail establishes the historical context; the new auction establishes the current opportunity.
Practical Futures Excess Highs and Lows Trading Workflow
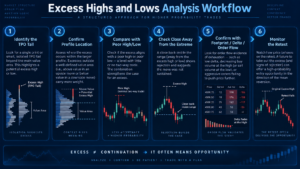
- Standardize your TPO session. RTH and ETH profiles can create different extremes.
- Use consistent TPO block and row settings. Changing aggregation changes the tail structure.
- Wait for the profile to develop sufficiently. Early apparent excess can disappear if later periods revisit the area.
- Confirm the tail is at the profile extreme. Interior one-TPO zones belong to single-print analysis.
- Compare with poor-extreme structure. Verify that the profile actually tapers rather than ending bluntly.
- Record contextual location. Prior highs/lows, value boundaries and composite references add meaning.
- Measure closing distance. Note whether the market remained away from the rejected extreme.
- Extend the level for future reference. Treat it as historical evidence, not guaranteed support/resistance.
- Wait for the retest. The current auction must prove rejection again.
- Remove the thesis when acceptance develops beyond the tail.
This workflow turns Futures Excess Highs and Lows into a repeatable auction-reading process rather than a visual pattern applied after every session reversal.
Common Futures Excess Highs and Lows Mistakes
1. Confusing Excess With Poor Highs and Lows
Excess shows taper and stronger rejection. Poor extremes remain blunt and lack convincing rejection.
2. Calling Every Single Print an Excess Tail
Single prints inside the profile are different from tails at the profile extreme.
3. Assuming a Tail Can Never Break
Historical rejection is not permanent. New information and participation can create acceptance beyond the old extreme.
4. Using One Universal Tail-Length Rule
Platforms can use configurable minimum TPO requirements. Document your methodology and test it consistently.
5. Ignoring the Completed Profile
An apparent tail can disappear if later TPO periods revisit the area before the session is complete.
6. Ignoring Current Order Flow
A retest should be evaluated from today’s transactions, not only yesterday’s profile shape.
7. Treating Excess as an Automatic Reversal Entry
Futures Excess Highs and Lows provide context. They do not determine entry timing or risk automatically.
8. Ignoring Session Type
An RTH selling tail and an overnight tail are formed by different participation environments. Label them separately.
Pros and Limitations of Futures Excess Highs and Lows
Pros
- Provides a clear TPO-based rejection structure.
- Complements poor-high and poor-low analysis.
- Creates useful future auction references.
- Works naturally with Auction Market Theory.
- Can be confirmed with footprint and delta data.
- Separates rejected extremes from unfinished-looking ones.
Limitations
- Tail definitions differ between platforms.
- Historical rejection can later fail.
- A tail does not provide entry timing by itself.
- Profile settings materially change the structure.
- Order-flow confirmation can still produce false signals.
- Strong trends can trade through previous excess rapidly.
Best For
Futures Excess Highs and Lows are most useful for intraday traders using TPO, Market Profile, Auction Market Theory and order-flow tools who want to distinguish completed-looking rejection from unfinished profile extremes.
Not Ideal For
They are less useful for traders seeking automatic reversal signals or anyone unwilling to standardize profile settings and wait for confirmation when historical tails are retested.
Futures Excess Highs and Lows FAQ
What are Futures Excess Highs and Lows?
Futures Excess Highs and Lows are thin TPO tails at profile extremes that indicate price explored an area and then moved away without spending much time there.
What is a buying tail?
A buying tail forms at the bottom of a profile when lower prices are rejected and the market moves higher.
What is a selling tail?
A selling tail forms at the top of a profile when higher prices are rejected and the market moves lower.
Are excess tails the same as single prints?
No. Both can involve one-TPO rows, but excess tails occur at profile extremes. Single-print zones occur inside the profile.
What is the difference between excess and a poor high?
Excess displays clearer tapering and rejection. A poor high contains multiple TPOs at the extreme and lacks convincing rejection.
What is the difference between excess and a poor low?
A buying-tail excess shows lower-price rejection. A poor low ends more bluntly and suggests the downside auction may not have been fully explored.
How many TPO rows make an excess tail?
There is no universal platform-independent number. Modern TPO software commonly lets users configure the minimum number of rows required for buying or selling tails.
Can excess act as support or resistance?
Previous tails can become useful reaction references, but they are not guaranteed support or resistance. The new auction must confirm whether the old rejection remains valid.
Can an old selling tail break?
Yes. If price trades through the tail and begins building time, volume and value above it, the previous rejection has been invalidated.
Can an old buying tail fail?
Yes. Acceptance below a previous buying tail shows that prices once rejected are now being accepted.
Can footprint charts confirm Futures Excess Highs and Lows?
Yes. Footprints can show whether aggression is absorbed, exhausted or effectively driving price during the formation or retest of a tail.
Can Volume Delta confirm a tail?
Delta can help explain the transaction flow, but the sign alone is insufficient. Compare aggressive volume with actual price progress and rejection.
Do Trend Days have excess?
They can. However, a strong directional auction may show limited opposing excess until the trend reaches a meaningful termination area.
Are TPO tails guaranteed reversal signals?
No. Futures Excess Highs and Lows record historical rejection. Future conditions can create a new auction that accepts through the same area.
Final Verdict: How to Use Futures Excess Highs and Lows Correctly
Futures Excess Highs and Lows complete an important part of the TradeboticsAI Market Profile cluster because they explain what strong auction rejection looks like at a profile extreme.
The structure contrasts directly with poor highs and poor lows:
Excess = rejection.
Poor extreme = insufficient rejection.
But even a strong historical tail is not permanent. A market that previously rejected 6,542 can later accept 6,542 when information, liquidity or participation changes.
The strongest TradeboticsAI process is:
TPO tail → meaningful location → rejection quality → closing distance → future retest → order-flow response → acceptance or renewed rejection.
Use Futures Excess Highs and Lows alongside Poor Highs and Poor Lows, Single Prints, Market Profile, Market Profile Day Types, Auction Market Theory, Volume Delta and Footprint Charts.
The objective is not to assume every TPO tail creates permanent support or resistance. It is to identify where the market previously rejected price, understand how strong that rejection was, and then let the future auction prove whether the reference is still valid.
Explore NinjaTrader for futures charting, footprint tools and simulated auction-market analysis
Affiliate Disclosure: TradeboticsAI may receive compensation when eligible users complete a qualifying action through certain affiliate links. Affiliate relationships do not determine our editorial conclusions.
Risk Disclosure: Futures trading involves substantial risk of loss and is not suitable for every investor. TPO tails, excess highs/lows, Market Profile, Volume Delta, footprint patterns and historical auction rejection do not predict future returns. Previous rejection levels can fail, market conditions can change quickly, and simulated results do not guarantee future live performance. Nothing on this page is personalized investment, financial, tax or trading advice.