Futures Market Profile Day Types 2026: Normal, Normal Variation, Trend, Neutral & Double Distribution Guide
Futures Market Profile Day Types classify how a trading session develops relative to its Initial Balance, value area and directional range extension. The classic framework includes Normal Day, Normal Variation Day, Trend Day and Neutral Day, while Double Distribution describes a session that develops two distinct areas of accepted value after a meaningful repricing. These structures are most useful as descriptive auction frameworks, not predictions made shortly after the open. A session can begin looking rotational and later develop into a directional auction, which is why the classification should be updated as TPO structure, value migration, Initial Balance extensions and order flow develop.
Quick Answer
Futures Market Profile Day Types help describe whether a futures session remained balanced, expanded moderately beyond its Initial Balance, developed a strong directional trend, explored both sides of the Initial Balance, or repriced into a second accepted distribution. A Normal Day remains largely contained by the Initial Balance; a Normal Variation Day develops a meaningful one-sided extension; a Trend Day continues directional price discovery; a Neutral Day commonly extends both sides of the Initial Balance; and a Double Distribution session creates two separate areas of value. Use these labels after sufficient structure develops rather than predicting a day type from the opening minutes alone.
Explore NinjaTrader for futures charting, Market Profile context, order-flow analysis and simulation
Affiliate Disclosure: TradeboticsAI may earn compensation when an eligible user completes a qualifying action through an affiliate link, at no additional cost to the user. Affiliate relationships do not determine our editorial conclusions.
What Are Futures Market Profile Day Types?
Futures Market Profile Day Types are classifications used in TPO and Market Profile analysis to describe how the day’s auction developed. Instead of viewing a session only through candlestick direction or net price change, the framework compares the completed range with the Initial Balance and studies where time and value accumulated.
TradingView’s current TPO documentation identifies four core distribution patterns: Normal Day, Normal Variation Day, Trend Day and Neutral Day. GoCharting documentation additionally describes Double Distribution profiles, where the market develops one area of accepted value, reprices and then forms another distribution around a different fair-price region.
The classifications should be treated as descriptive models. Exact terminology and thresholds can vary between platforms, educators and Market Profile methodologies. A trader should therefore select one definition and use it consistently when collecting historical statistics.
Official references:
TradingView TPO Documentation
and
GoCharting Market Profile Documentation.
Futures Market Profile Day Types are valuable because they force the trader to answer concrete questions: How much of the session remained inside Initial Balance? Did price extend one side or both sides? Was the extension accepted? Did the market create one distribution or reprice into another? Where did the POC and value area migrate?
Why Initial Balance Matters for Futures Market Profile Day Types
Initial Balance is the main reference used to distinguish many Futures Market Profile Day Types. In classic TPO analysis it commonly represents the range produced by the first two 30-minute periods, although modern platforms can allow different configurations.
The critical measurements are:
- IB High: highest price reached during the Initial Balance window;
- IB Low: lowest price reached during the Initial Balance window;
- IB Range: IB High minus IB Low;
- Range Extension: subsequent trading above IB High or below IB Low;
- Total Session Range: completed session high minus session low.
TradingView describes a Normal Day as one where roughly 85% of the period’s range remains within the Initial Balance Range. A Normal Variation Day extends beyond the IB, while a Trend Day creates substantially larger directional expansion. Neutral Day structure commonly involves extensions on both sides.
Those percentages and range relationships are useful classifications, but they should not be treated as natural laws. The more important principle is how much additional price discovery occurred after the opening auction.
For the dedicated framework, see Futures Initial Balance Trading 2026.
Futures Market Profile Day Types: Normal Day
A Normal Day is the most balanced of the classic Futures Market Profile Day Types. TradingView describes it as a session where about 85% of the period’s total range remains within Initial Balance, meaning activity outside the IB is limited or absent.
Typical characteristics include:
- a relatively substantial Initial Balance compared with the completed range;
- limited range extension;
- considerable TPO overlap;
- rotation around an accepted central region;
- POC developing near the middle of the profile;
- limited directional value migration;
- responsive activity at session extremes.
A Normal Day does not require a perfectly symmetrical bell-shaped profile. Market structure rarely matches textbook diagrams exactly. The essential characteristic is that most price discovery happened early and subsequent trade remained largely rotational.
This structure often makes mean-reversion and value-area references more relevant than on a directional Trend Day. However, traders should not automatically fade every move toward IB High or IB Low. Current order flow still determines whether the boundary remains accepted.
A late-session breakout can also change what initially looked like a Normal Day. Futures Market Profile Day Types should not be finalized before the structure has developed sufficiently.

Futures Market Profile Day Types: Normal Variation Day
Normal Variation Day develops more directional range expansion than a Normal Day but less persistent discovery than a classic Trend Day.
TradingView describes this structure as a session where price extends beyond Initial Balance, with range extension potentially varying from only a few ticks to approximately twice the IB size.
Typical characteristics include:
- a completed Initial Balance followed by meaningful one-sided extension;
- one side of the IB becomes more important than the other;
- value can migrate in the direction of the extension;
- the opposite side of Initial Balance often remains intact;
- directional participants influence the session without maintaining uninterrupted trend behavior;
- some rotation and overlap remain visible.
Suppose ES establishes a 16-point Initial Balance and subsequently trades 12 points above IB High while never breaking IB Low. The session has clearly extended, but that does not automatically make it a Trend Day.
The trader should evaluate whether the market continually discovers higher prices or whether the extension develops into a new rotational distribution.
Among Futures Market Profile Day Types, Normal Variation is especially important because many intraday sessions fall somewhere between pure balance and strong trend. Forcing every extended session into a Trend Day label can lead to overly aggressive continuation assumptions.
Futures Market Profile Day Types: Trend Day
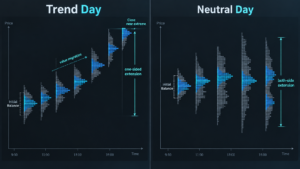
Trend Day is the most directional of the classic Futures Market Profile Day Types. TradingView describes a Trend Day as one where longer-horizon participation pushes the range successively farther, creating an extension more than twice the Initial Balance and closing near the extended extreme.
A bullish Trend Day can show:
- relatively compressed Initial Balance;
- successful extension above IB High;
- little sustained return toward IB midpoint;
- higher developing value;
- POC migration in the trend direction;
- limited overlap between successive TPO periods;
- single prints or thin structure left behind during initiative movement;
- repeated pullbacks that fail before reaching older value;
- close near the upper portion of the session range.
The bearish version is structurally identical in the opposite direction.
A Trend Day should not be predicted merely because the market had an Open Drive. An Open Drive increases directional information early, but the session still needs to preserve directional efficiency as it develops.
Likewise, a narrow Initial Balance does not guarantee a Trend Day. It simply leaves more potential range available if meaningful initiative activity arrives.
One of the biggest mistakes in Futures Market Profile Day Types is repeatedly fading a mature directional session because price appears “too far” from POC or VWAP. Trend structure means the market is actively searching for a different area of value.
Futures Market Profile Day Types: Neutral Day
Neutral Day represents a two-sided auction where the market extends outside Initial Balance in one direction, reverses and often creates an extension at the opposite side.
TradingView’s TPO documentation describes Neutral Day as a session where traders temporarily extend the Initial Balance and then price reverses, with similar behavior potentially occurring at the opposite boundary.
Typical characteristics include:
- range extension above IB High and below IB Low;
- failed directional attempts;
- significant two-way participation;
- greater uncertainty than a Trend Day;
- multiple opportunities for trapped breakout traders;
- strong importance of closing location.
The final close can add important context. A session may extend both sides but finish near one extreme, suggesting that one side gained late control after a two-way auction. Another Neutral Day may close near the center, reflecting unresolved balance.
For Futures Market Profile Day Types, Neutral Day demonstrates why the first Initial Balance break cannot automatically be treated as the day’s dominant direction.
A failed first extension followed by a successful opposite extension can completely change the intraday auction. This is where trapped traders, liquidity sweeps and order-flow failure can become useful supporting concepts.

Futures Market Profile Day Types: Double Distribution Day
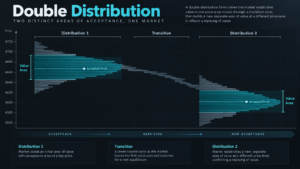
Double Distribution is a useful extension of the standard Futures Market Profile Day Types framework. GoCharting describes Double Distribution as a session where the market initially distributes around one accepted area, then something causes perceived fair value to change and a second distribution forms around a new region.
The completed profile can resemble a capital letter “B” when the two accepted distributions are separated by a thinner section.
A bullish example might develop as follows:
- ES spends the morning building value between 6,500 and 6,510.
- A directional catalyst pushes price rapidly above the first distribution.
- The transition leaves single prints or relatively thin TPO structure.
- Price stabilizes between 6,522 and 6,532.
- A second accepted distribution develops at the higher level.
The critical information is not the visual B shape alone. The market has moved from one fair-price region to another.
A Double Distribution session therefore contains three distinct areas:
- the original distribution;
- the transition or low-acceptance zone;
- the second distribution.
The transition often becomes an important future reference. If price later accepts through that thin area, the two distributions can begin behaving like one larger auction. If the area continues to reject trade, it may separate two distinct value regions.
Among Futures Market Profile Day Types, Double Distribution provides particularly useful information gain because it shows not merely directional movement but an actual migration from one accepted auction to another.
Futures Market Profile Day Types Compared
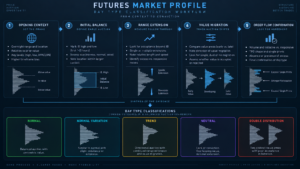
| Day Type | Initial Balance Relationship | Auction Character | Main Risk |
|---|---|---|---|
| Normal Day | Most range remains within IB | Balanced and rotational | Chasing weak breakouts |
| Normal Variation | Meaningful extension primarily one side | Directional influence plus rotation | Assuming every extension becomes Trend Day |
| Trend Day | Large one-sided range extension | Persistent price discovery | Repeatedly fading directional value migration |
| Neutral Day | Both sides of IB commonly extended | Two-sided exploration | Assuming the first breakout controls the session |
| Double Distribution | Can vary | Repricing from one accepted area to another | Treating the transition zone as automatically filled |
This table shows why Futures Market Profile Day Types should not be reduced to simple bullish and bearish labels. Normal, Neutral and Double Distribution sessions can contain large intraday moves while still describing very different auction processes.
Developing vs Completed Futures Market Profile Day Types
A major analytical mistake is labeling Futures Market Profile Day Types too early.
At 10:15 AM, a session might appear to be a Normal Day simply because price remains inside Initial Balance. At 11:30 AM, the market can break IB High, leave single prints and begin directional value migration. By the close, the completed profile may be classified as Normal Variation, Trend or Double Distribution.
TradeboticsAI therefore separates three states:
- Developing hypothesis: current structure suggests one possible day type;
- Structural confirmation: enough Initial Balance extension, value behavior and range development exist to narrow the classification;
- Completed classification: the finished session can be categorized without pretending the final shape was known in advance.
This matters for backtesting. If a strategy uses the final day’s profile to justify an entry that occurred hours before the final structure existed, the test contains hindsight bias.
Futures Market Profile Day Types should help traders interpret evolving information, not import future knowledge into earlier decisions.
Opening Types vs Futures Market Profile Day Types
Opening types and day types are related but not interchangeable.
Futures Opening Types 2026 classifies the first phase of the session as Open Drive, Open Test Drive, Open Rejection Reverse or Open Auction.
Futures Market Profile Day Types classify the broader session after substantially more auction structure develops.
| Framework | Time Focus | Main Question |
|---|---|---|
| Opening Type | Beginning of session | How is the market opening? |
| Initial Balance | Opening range | How much territory was explored early? |
| Day Type | Broader/completed session | How did the auction ultimately develop? |
An Open Drive can become a Trend Day, but it can also fail and eventually produce Neutral structure. An Open Auction can remain Normal or later break into Normal Variation.
Do not create deterministic rules such as “Open Drive = Trend Day.” The two frameworks provide sequential evidence, not automatic mappings.
Value Migration, POC and Futures Market Profile Day Types
Initial Balance describes range expansion, but value migration helps show whether the market actually accepted the extension.
For Futures Market Profile Day Types, monitor:
- developing TPO POC;
- Volume POC where available;
- VAH and VAL migration;
- new TPO accumulation outside the original value area;
- whether pullbacks return to older value or remain around newer prices.
Consider a bullish IB breakout. If price trades higher but POC remains deep inside the original range and the market repeatedly returns to prior value, the extension has weaker acceptance.
If the developing POC and value area migrate progressively higher, the market is showing a stronger willingness to conduct business at the new prices.
This is especially important when distinguishing Normal Variation from Trend Day or interpreting a developing Double Distribution.
Use Futures Volume Profile 2026 and Futures Auction Market Theory 2026 for the broader acceptance framework.
Order Flow Confirmation for Futures Market Profile Day Types
TPO describes the auction’s time structure. Order flow can show whether aggressive participants are effectively supporting that structure.
Footprint Charts
A developing Trend Day with repeated aggressive buying and continued upward price progress provides stronger directional confirmation than a profile expanding higher while aggressive buyers repeatedly fail.
Volume Delta
Futures Volume Delta 2026 can distinguish aggression from effectiveness. Strong positive delta accompanied by higher acceptance supports bullish discovery; strong positive delta with no progress can indicate absorption or trapped buyers.
Cumulative Delta
CVD can show whether broader aggressive flow confirms range extension. Divergence should remain context rather than an automatic reversal trigger.
Stacked Imbalance
Futures Stacked Imbalance 2026 can show repeated aggressive transactions during a breakout or Trend Day. A stack that fails to produce progress can provide the opposite information.
Time & Sales
Tape can help determine whether directional activity is accelerating or fading as the profile extends.
Order flow does not determine Futures Market Profile Day Types by itself. It answers a complementary question: is the aggressive side efficiently producing the profile development visible on TPO?
Explore NinjaTrader Order Flow+ tools and practice Market Profile context in simulation
TradeboticsAI Futures Market Profile Day Types Framework
TradeboticsAI evaluates Futures Market Profile Day Types using six layers. The objective is to classify the market from observable evidence without pretending the final session structure is known at the open.
| Layer | Question | Evidence |
|---|---|---|
| 1. Initial Balance | How large is the opening range? | Relative IB width and historical percentile |
| 2. Range Extension | Which side of IB extends? | None, one-sided or both-sided extension |
| 3. Efficiency | Does the extension produce sustained progress? | TPO overlap, pullback depth, single prints |
| 4. Value Migration | Where is business being accepted? | POC, VAH, VAL and secondary distributions |
| 5. Order Flow | Is aggression effective? | Footprint, Volume Delta, CVD and tape |
| 6. Closing Location | Where did the session finish? | Center, original value or directional extreme |
This framework produces a decision tree:
- little extension + broad overlap → Normal Day candidate;
- one meaningful extension + continued rotation → Normal Variation candidate;
- persistent one-sided extension + value migration → Trend Day candidate;
- extensions on both sides → Neutral Day candidate;
- two distinct accepted distributions separated by thin structure → Double Distribution candidate.
The classification remains provisional until enough evidence exists. This makes Futures Market Profile Day Types a live decision framework rather than a hindsight exercise.
Practical Futures Market Profile Day Types Examples: ES
Example 1: Normal Day
ES establishes an Initial Balance from 6,500.00 to 6,522.00. During the remainder of the session, price trades only briefly to 6,524.00 and spends most of its time rotating between 6,504.00 and 6,520.00.
POC remains near the center, and neither directional side establishes sustained control. This structure is consistent with a Normal Day.
Example 2: Normal Variation Day
ES creates a 14-point IB between 6,500.00 and 6,514.00. After the opening period, price breaks IB High and reaches 6,525.00. The market forms value above IB High but still produces several rotational pullbacks.
IB Low remains untouched. This is more consistent with Normal Variation than with a full Trend Day.
Example 3: Trend Day
ES develops a relatively narrow 10-point Initial Balance. Buyers then extend above IB High repeatedly. Pullbacks remain shallow, TPO overlap is limited, single prints appear beneath new distributions and developing value migrates higher.
By the close, the total session range exceeds twice the original IB and ES finishes near the upper extreme. This fits the classic Trend Day description.
Example 4: Neutral Day
ES first trades six points above IB High but fails. The market rotates through the entire Initial Balance and later trades eight points below IB Low.
Both directional attempts attracted participation during the session. The profile shows two-sided exploration rather than persistent one-directional discovery.
This structure is consistent with Neutral Day.
Example 5: Double Distribution
ES spends the morning between 6,500.00 and 6,510.00. A major directional move then pushes price rapidly to 6,524.00, leaving a thin TPO region from approximately 6,512.00 to 6,517.00.
The afternoon auction stabilizes between 6,522.00 and 6,532.00 and develops a second accepted distribution.
This is a classic Double Distribution concept: the market established one value area, repriced and then discovered another.
These examples show why Futures Market Profile Day Types should be classified through the complete structural process rather than by final candle direction alone.
Practical Futures Market Profile Day Types Trading Workflow
- Standardize the session. Use the same RTH/ETH definition, timezone and TPO settings.
- Mark prior structure. Prior POC, VAH, VAL, high, low and overnight range provide context.
- Classify the opening separately. Record Open Drive, Test Drive, Rejection Reverse or Open Auction if applicable.
- Let Initial Balance complete. Measure IB High, IB Low and relative width.
- Track range extension. Record whether neither, one or both sides extend.
- Measure extension magnitude. Compare total range and directional extension with IB width.
- Monitor value migration. Developing POC, VAH and VAL help distinguish exploration from acceptance.
- Observe TPO structure. Single prints, overlap and secondary distributions provide additional information.
- Use order flow for confirmation. Compare aggressive transactions with actual price progress.
- Keep the classification provisional. Do not force a final label too early.
- Record the completed day type after the session. This creates clean data for future testing.
- Compare outcomes by day type. Measure your own performance rather than relying on unsupported universal win rates.
This process allows Futures Market Profile Day Types to become measurable research variables. Over time, TradeboticsAI can compare average range extension, closing location, next-session behavior and strategy performance for each classification.
Common Futures Market Profile Day Types Mistakes
1. Predicting the Final Day Type Too Early
The completed distribution does not exist during the first hour. Use developing hypotheses, not hindsight labels.
2. Assuming Open Drive Always Becomes Trend Day
Open Drive can fail. Opening type and completed day type are separate frameworks.
3. Calling Every IB Break a Trend Day
A one-sided extension can become Normal Variation, fail back into balance or evolve into Neutral structure.
4. Ignoring Relative Initial Balance Width
A 15-point IB can be narrow in one volatility regime and wide in another. Compare it with recent comparable sessions.
5. Using Only the Final Profile Shape
A similar-looking finished profile can result from different intraday paths. Sequence matters.
6. Ignoring Value Migration
Price extension without developing acceptance is different from a market that moves POC and value consistently in the same direction.
7. Confusing Double Distribution With Any B-Shaped Profile
The useful concept is two separate accepted areas created by repricing, not merely visual resemblance to a letter.
8. Treating Day Type as an Entry Signal
Futures Market Profile Day Types provide context. Entry, stop placement and position sizing still require a defined trading methodology.
9. Ignoring Session Configuration
Different RTH/ETH profiles can produce different Initial Balance and distribution classifications.
10. Using Unsupported Probability Claims
Do not assume one day type occurs a fixed percentage of the time or predicts the next day without a documented dataset, contract, session and sample period.
Pros and Limitations of Futures Market Profile Day Types
Pros
- Creates a structured description of the entire session.
- Combines naturally with Initial Balance and TPO.
- Separates rotational sessions from directional discovery.
- Helps interpret failed and successful range extensions.
- Integrates with value migration and order flow.
- Can be converted into a measurable research dataset.
Limitations
- Many classifications are clearest only late in the session.
- Definitions differ slightly between methodologies.
- Profiles can evolve from one developing type into another.
- No day type guarantees a specific trading outcome.
- Session settings materially affect classification.
- Historical profile shape alone does not provide execution timing.
Best For
Futures Market Profile Day Types are most useful for intraday futures traders using TPO, Initial Balance, Volume Profile, Auction Market Theory or order-flow tools who want a consistent framework for classifying session structure.
Not Ideal For
They are less useful for traders looking for an automatic first-minute buy/sell indicator or anyone unwilling to update a developing classification when later market evidence changes.
Futures Market Profile Day Types FAQ
What are Futures Market Profile Day Types?
Futures Market Profile Day Types classify how a futures session develops relative to Initial Balance, range extension, value and directional auction structure.
What are the main Market Profile day types?
Common classifications include Normal Day, Normal Variation Day, Trend Day, Neutral Day and Double Distribution Day.
What is a Normal Day in Market Profile?
A Normal Day remains largely inside Initial Balance, with limited later range extension and predominantly balanced two-way trade.
What is a Normal Variation Day?
Normal Variation develops a meaningful one-sided extension outside Initial Balance but retains more rotation and overlap than a classic Trend Day.
What is a Trend Day?
A Trend Day shows persistent directional range expansion, limited opposing rotation, value migration and commonly a close near the directional extreme.
What is a Neutral Day?
A Neutral Day commonly extends both sides of Initial Balance, reflecting strong two-way exploration and failed directional attempts.
What is a Double Distribution Day?
Double Distribution occurs when the market forms one accepted distribution, reprices through a relatively thin region and establishes a second distribution around another fair-price area.
Does a narrow Initial Balance predict a Trend Day?
No. A narrow IB can leave more potential room for expansion, but it does not guarantee a Trend Day.
Does an Open Drive always become a Trend Day?
No. An Open Drive describes the beginning of the session. The drive can later fail, rotate or develop a different completed profile.
Can a day type change during the session?
The developing classification can change because the final structure has not yet formed. A session that initially looks Normal can later become Normal Variation, Neutral, Trend or Double Distribution.
How does Initial Balance help classify day type?
Initial Balance provides the opening range against which later range extensions are measured. Whether neither, one or both sides extend is a major classification input.
How does POC migration help?
POC migration shows where the market is increasingly conducting business. Directional POC and value migration can strengthen evidence of acceptance during a Trend or Normal Variation Day.
Do single prints indicate a Trend Day?
Single prints can accompany initiative directional movement, but they do not automatically classify the entire day as a Trend Day.
Can Footprint charts confirm Futures Market Profile Day Types?
Footprints can show whether aggressive buying or selling is effectively supporting the profile development, becoming absorbed or becoming trapped.
Should day types be used as trading signals?
No. Futures Market Profile Day Types are contextual classifications. Entry timing, invalidation, position sizing and risk limits still require separate rules.
Can Market Profile day types predict the next session?
Not reliably by themselves. A completed profile can provide useful context for the next session, but overnight information, gaps, volatility and new participation can change the auction immediately.
Final Verdict: How to Use Futures Market Profile Day Types Correctly
Futures Market Profile Day Types are most useful when they describe what the auction actually produced rather than what the trader hopes will happen.
The framework moves from increasingly directional and complex session structures:
Normal → Normal Variation → Trend
while Neutral Day describes meaningful two-sided range exploration and Double Distribution describes repricing from one accepted area to another.
The strongest TradeboticsAI workflow is:
opening context → Initial Balance → range extension → TPO efficiency → value migration → order flow → closing location → completed day type.
Use Futures Market Profile Day Types alongside Futures Opening Types, Initial Balance Trading, Auction Market Theory, Single Prints, Volume Delta and Futures Order Flow Trading.
The objective is not to decide at 9:35 AM that the market “must” become a Trend Day. It is to classify the developing auction from observable structure, continually test that hypothesis and record the completed session accurately enough to build a useful TradeboticsAI dataset over time.
Explore NinjaTrader for futures charting, order flow and simulated Market Profile analysis
Affiliate Disclosure: TradeboticsAI may receive compensation when eligible users complete a qualifying action through certain affiliate links. Affiliate relationships do not determine our editorial conclusions.
Risk Disclosure: Futures trading involves substantial risk of loss and is not suitable for every investor. Market Profile day types, Initial Balance, TPO distributions, Volume Delta, footprint patterns and historical auction behavior do not predict future returns. Developing day-type classifications can change as the session evolves, and simulated results do not guarantee future live performance. Nothing on this page is personalized investment, financial, tax or trading advice.