Futures Initial Balance Trading 2026: IB High, IB Low, Width & Range Extensions
Futures Initial Balance Trading uses the market’s opening price range as a structural reference for the rest of the futures session. In classic Market Profile workflows, the Initial Balance is commonly built from the first two 30-minute TPO periods, creating an IB High, IB Low and total IB range. The concept becomes useful only after the opening range is established: traders then evaluate whether price remains balanced inside it, extends beyond one side, rejects the extension or begins building acceptance outside the range. The IB is not a mechanical breakout signal, and a narrow or wide range does not guarantee a specific day type.
Quick Answer
Futures Initial Balance Trading measures the opening range of a futures session and uses its high, low, midpoint and width as intraday reference points. A break above IB High becomes more meaningful when price accepts above the range; a break that quickly returns inside can become a failed-extension setup. IB width should be evaluated relative to the same contract and comparable recent sessions rather than with universal point thresholds. Extensions such as 0.5× or 1.0× IB can be used as planning references, but they are not guaranteed targets.
Explore NinjaTrader for futures charting, order-flow tools and simulated trading
Affiliate Disclosure: TradeboticsAI may earn compensation when an eligible user completes a qualifying action through an affiliate link, at no additional cost to the user. Affiliate relationships do not determine our editorial conclusions.
What Is Futures Initial Balance Trading?
Futures Initial Balance Trading is an intraday framework built around the price range established during the opening portion of a futures session. Market Profile traders traditionally use the first two TPO blocks as an important opening range, although the precise blocks and session definition can vary by methodology and product.
TradingView’s official TPO documentation defines the Initial Balance Range as the range of prices visited during the first time blocks of the profile period. Its implementation allows the number of blocks included in the Initial Balance calculation to be configured.
This point matters because traders often repeat “the Initial Balance is always the first hour” as if every platform and market uses one mandatory definition. The classic one-hour framework is widely used, especially when two 30-minute TPO periods are selected, but the trader still needs a consistent session template.
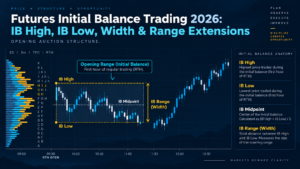
The Initial Balance creates three immediate references:
- IB High: highest price reached during the selected opening window;
- IB Low: lowest price reached during the selected opening window;
- IB Range: distance between the high and low.
Those levels allow Futures Initial Balance Trading to classify what happens next: balance inside the range, extension above it, extension below it, failure back inside or sustained price discovery outside.
Futures Initial Balance Trading: IB High, IB Low, Midpoint & Range
The arithmetic behind Futures Initial Balance Trading is simple.
IB Range = IB High − IB Low
IB Midpoint = (IB High + IB Low) ÷ 2
Suppose ES establishes:
- IB High: 6,524.25
- IB Low: 6,510.75
The Initial Balance width is:
6,524.25 − 6,510.75 = 13.50 ES points.
The midpoint is:
(6,524.25 + 6,510.75) ÷ 2 = 6,517.50.
These values do not predict direction. They create an objective map. A trader can now distinguish price trading above the opening auction, below it or rotating inside it.
The midpoint can also help describe internal balance. If price repeatedly crosses the IB midpoint after both the high and low have been tested, the session may be behaving more rotationally than a market that breaks one side and never returns.

Which Session Should Futures Initial Balance Trading Use?
The answer depends on the contract and methodology. Futures Initial Balance Trading becomes unreliable when the trader changes the session definition from one day to another.
For U.S. equity-index futures such as ES and NQ, many intraday Market Profile workflows build the Initial Balance around the U.S. cash-session open and use the first two 30-minute periods. Other futures products have different primary liquidity windows, and some traders maintain separate overnight and daytime profiles.
TradingView deliberately allows the number of opening TPO blocks used in its Initial Balance calculation to be configured. That is a useful reminder that Initial Balance is a framework, not a universal exchange order type.
Before testing any strategy, record:
- contract;
- session template;
- timezone;
- Initial Balance start time;
- Initial Balance end time;
- TPO block length;
- whether overnight trading is included or separated.
Do not compare results from a 30-minute opening range with results from a 60-minute Initial Balance and treat them as one dataset.
This distinction also prevents a common problem with Futures Initial Balance Trading: a level can appear important on one session template and irrelevant on another because the underlying ranges were calculated differently.
How to Evaluate Futures Initial Balance Width
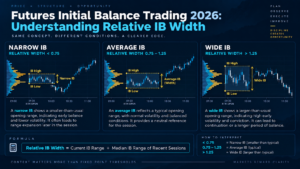
The width of the Initial Balance describes how much price discovery already occurred during the opening window. Traders often classify an IB as narrow, average or wide.
The dangerous shortcut is assigning permanent thresholds such as “ES under X points is narrow” or “NQ over Y points is wide.” Futures volatility changes over time. A 15-point ES Initial Balance can be unusually large during one regime and ordinary during another.
Futures Initial Balance Trading is more robust when width is compared against recent Initial Balances from the same contract, session definition and market regime.
| IB Condition | What It Means | What It Does NOT Guarantee |
|---|---|---|
| Relatively Narrow | Opening auction covered less distance than comparable sessions | A trend day or breakout must occur |
| Average | Opening range is near its recent typical size | A particular day type |
| Relatively Wide | Substantial early-session movement already occurred | The market must remain inside the IB |
A narrow range can precede expansion because comparatively little territory has been explored. But it can also remain narrow for the rest of the session. A wide range can encourage rotation, yet strong information flow can push price much farther.
The IB is context, not destiny.
TradeboticsAI Relative IB Width Model
To make Futures Initial Balance Trading more comparable across volatility regimes, TradeboticsAI uses a normalized concept rather than fixed-point labels.
Relative IB Width = Current IB Range ÷ Median IB Range of Recent Comparable Sessions
Example:
- Current ES IB: 13.50 points
- Median IB of previous 20 comparable sessions: 18.00 points
- Relative IB Width: 13.50 ÷ 18.00 = 0.75
The current range is therefore 75% of the recent median.
Another session might produce:
- Current IB: 27.00 points
- Recent median: 18.00 points
- Relative IB Width: 1.50
The second IB is 150% of recent median width.
This does not create a magic threshold. Its advantage is normalization. A trader can test whether extension behavior changes when the IB is unusually narrow or wide relative to recent conditions rather than relying on outdated absolute-point assumptions.
An even more rigorous variation is an IB percentile: rank today’s width against the previous 20, 40 or 60 comparable sessions. A width near the 10th percentile is objectively narrow relative to that sample; one near the 90th percentile is objectively wide.
This information-gain model makes Futures Initial Balance Trading easier to test across changing volatility regimes.
Futures Initial Balance Extensions
Once the IB is complete, traders sometimes project multiples of the range above IB High and below IB Low. These are planning references, not guaranteed price targets.
Using the earlier ES example:
- IB High = 6,524.25
- IB Low = 6,510.75
- IB Range = 13.50 points
Possible references are:
| Reference | Formula | ES Example |
|---|---|---|
| Upper 0.5× | IB High + 0.5 × IB Range | 6,531.00 |
| Upper 1.0× | IB High + IB Range | 6,537.75 |
| Lower 0.5× | IB Low − 0.5 × IB Range | 6,504.00 |
| Lower 1.0× | IB Low − IB Range | 6,497.25 |
Futures Initial Balance Trading should never assume price will automatically reach these references. Their value is that they create objective range-expansion measurements.
If ES trades 20 points above an IB only 10 points wide, the market has extended 2× the original opening range. That describes the magnitude of the session more clearly than saying price simply “went up a lot.”
Initial Balance Breakout vs Real Acceptance
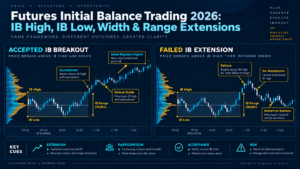
Price trading one tick beyond IB High or IB Low is only an extension. It does not prove that a sustainable breakout has occurred.
For Futures Initial Balance Trading, the stronger question is whether the auction accepts the new prices.
Evidence of Acceptance Above IB High
- price remains outside the IB rather than immediately returning;
- time begins accumulating above IB High;
- Volume Profile starts developing outside the opening range;
- pullbacks hold near or above the old IB High;
- aggressive buying produces continued price progress;
- value begins migrating upward.
Evidence of Acceptance Below IB Low
The same logic applies in reverse: sustained trade below IB Low, failed reclaim attempts, developing value beneath the range and effective aggressive selling.
This acceptance framework connects Futures Initial Balance Trading directly with Futures Auction Market Theory 2026.
The IB establishes a boundary. The auction tells you whether the boundary actually mattered.
Failed Futures Initial Balance Extensions
A failed extension occurs when price trades outside the Initial Balance but cannot sustain activity there and returns inside the range.
Example:
- ES establishes IB High at 6,524.25.
- Price trades to 6,527.00.
- Footprint data shows aggressive buying above the IB.
- Price fails to make additional progress.
- ES returns below 6,524.25.
- A retest of IB High from underneath fails.
The important information is not merely that the high was exceeded. The breakout attracted activity and then failed to establish acceptance.
A failed IB extension can overlap with several existing TradeboticsAI concepts:
- Futures Liquidity Sweep if an obvious high was swept;
- Futures Trapped Traders if breakout buyers became vulnerable;
- Futures Absorption Trading if heavy buying failed against passive selling;
- Futures Exhaustion Trading if aggressive participation faded near the extreme.
These labels should not be stacked without purpose. The core Futures Initial Balance Trading observation is simple: price extended, failed to build acceptance and returned to the original opening auction.
What If Both Sides of the Initial Balance Break?
A session that extends above IB High and below IB Low contains different information from a clean one-directional extension.
Both-side extension can indicate:
- strong two-way auction activity;
- failure of the first directional attempt;
- news-driven volatility;
- a neutral-style session;
- rapid repricing followed by reversal;
- a broadening auction rather than clean trend development.
Do not assume the second break automatically wins. If price first breaks IB High, returns inside and later breaks IB Low, the lower extension still needs to prove acceptance.
A useful Futures Initial Balance Trading workflow tracks sequence as well as direction:
Which side broke first? Did it fail? Did the opposite extension build acceptance? Where did value migrate?
This provides more information than simply recording that both IB boundaries were touched.
Futures Initial Balance Trading With TPO and Market Profile
The Initial Balance is most naturally interpreted inside the broader TPO structure.
TradingView’s TPO documentation explicitly displays:
- IB High;
- IB Low;
- IB Range;
- Value Area High;
- Value Area Low;
- TPO Point of Control;
- single prints;
- poor highs and poor lows.
This allows Futures Initial Balance Trading to answer more sophisticated questions.
For example, a break above IB High that creates Futures Single Prints and then forms a second accepted distribution above the range is structurally different from an IB break that immediately collapses back through the opening profile.
Likewise, a session that remains largely inside the Initial Balance while developing a central POC is behaving differently from a session whose POC migrates continually outside the IB.
Use Futures Market Profile 2026 for the broader TPO framework and Futures Poor Highs and Poor Lows 2026 for unfinished auction extremes.
Futures Initial Balance Trading With Order Flow
The IB tells you where the opening boundary exists. Order flow helps evaluate what happens when price reaches or breaks it.
Footprint Charts
A footprint can show whether aggressive buying accompanies an IB High break or aggressive selling accompanies an IB Low break. More importantly, it reveals whether that aggression produces progress.
Volume Delta
Strong positive Futures Volume Delta above IB High becomes continuation evidence only when price responds successfully. Strong positive delta with no progress can indicate absorption.
Cumulative Delta
Futures Cumulative Delta can show whether broader aggressive pressure confirms or diverges from the range extension.
Stacked Imbalance
A Futures Stacked Imbalance breaking through an IB boundary can show repeated aggressive transactions across several prices. It still requires acceptance.
DOM and Time & Sales
DOM provides current resting depth while Time & Sales records completed transactions. Use them as separate layers rather than assuming visible liquidity equals executed flow.
Explore NinjaTrader order-flow tools and practice IB setups in futures simulation
TradeboticsAI Futures Initial Balance Trading Decision Matrix
TradeboticsAI evaluates Futures Initial Balance Trading with six layers rather than treating every IB break as a signal.
| Layer | Question | Evidence to Track |
|---|---|---|
| 1. Definition | Was the IB calculated consistently? | Same session, timezone and opening window |
| 2. Relative Width | Is today’s IB narrow or wide relative to recent sessions? | Median ratio or historical percentile |
| 3. Extension | Which side of the IB is being tested? | IB High, IB Low and range multiple |
| 4. Participation | Is real aggressive flow supporting the break? | Footprint, delta, tape, imbalance |
| 5. Acceptance | Is the market conducting business outside the IB? | Time, volume, value migration and retests |
| 6. Risk | What invalidates the thesis? | Return inside IB, failed reclaim or structural break |
The model creates four primary states:
- Inside IB: opening balance remains intact.
- Extension + acceptance: directional auction is developing outside the range.
- Extension + rejection: failed breakout or failed auction.
- Both-side extension: two-way or neutral-style expansion requiring additional context.
This state model is more useful than predicting a day type before the market has provided enough evidence.
Practical Futures Initial Balance Trading Example: ES
Assume ES establishes the following Initial Balance:
- IB High: 6,524.25
- IB Low: 6,510.75
- IB Range: 13.50 points
- IB Midpoint: 6,517.50
The previous 20 comparable sessions have a median Initial Balance of 18 points.
Today’s relative width is:
13.50 ÷ 18.00 = 0.75.
The opening range is therefore relatively compressed compared with the recent sample.
Scenario A: Accepted Upside Extension
ES trades above 6,524.25 and reaches 6,527.00. The footprint shows sustained aggressive buying, Cumulative Delta rises and price remains above IB High during the next pullback.
Volume starts accumulating between 6,525.00 and 6,529.00. The developing POC migrates above the opening range.
Price then reaches the 0.5× upper extension at 6,531.00.
This is a coherent Futures Initial Balance Trading continuation sequence:
relatively narrow IB → upside extension → effective buying → successful retest → acceptance → range expansion.
Scenario B: Failed Upside Extension
Instead, suppose ES trades to 6,527.00 with strong positive delta but cannot progress. Price quickly returns below 6,524.25 and a retest of IB High from underneath fails.
Now the same original breakout has a different interpretation:
extension → aggressive buying → poor progress → rejection → return to balance.
The 0.5× and 1.0× upside projections should not be treated as inevitable targets after the breakout has failed.
Scenario C: Both-Side Extension
ES first breaks IB High, fails, rotates through the range and later trades below 6,510.75. The lower break must then be evaluated independently. If value begins forming below IB Low, the downside auction may be gaining acceptance. If price immediately reclaims the range again, the session remains strongly two-sided.
Practical Futures Initial Balance Trading Workflow
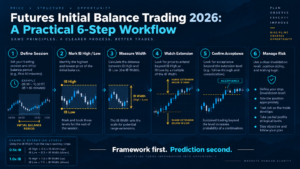
- Choose one session definition. Do not change the opening window based on what makes the historical chart look better.
- Calculate IB High and IB Low. Wait until the defined Initial Balance period is complete.
- Calculate IB width and midpoint. Keep the process objective.
- Normalize the range. Compare width with recent comparable sessions rather than permanent point thresholds.
- Mark optional extension references. 0.5×, 1.0× or other tested multiples can quantify expansion.
- Wait for an actual boundary test. Do not anticipate an extension prematurely.
- Measure participation. Footprint, delta and tape can show whether participants are committing beyond the range.
- Test acceptance. Determine whether time and volume are building outside the IB.
- Watch the retest. A former IB boundary that holds from the opposite side can strengthen continuation; a reclaim back inside can signal failure.
- Size risk independently. Use a defined invalidation and appropriate position size instead of assuming the IB guarantees direction.
The Futures Position Size Calculator and Futures Risk Reward Calculator can help separate setup quality from account-level risk.
Common Futures Initial Balance Trading Mistakes
1. Using Universal Point Thresholds Forever
Market volatility changes. Compare IB width with recent comparable sessions rather than assuming one fixed ES or NQ range is always narrow or wide.
2. Changing the Initial Balance Window
A backtest becomes unreliable when the IB period changes from session to session without a predefined rule.
3. Trading the First Tick Outside the IB
A one-tick extension proves only that price crossed the boundary. Futures Initial Balance Trading needs acceptance or rejection context.
4. Assuming Narrow IB Means Trend Day
A relatively narrow opening range can create room for later expansion but does not force directional movement.
5. Assuming Wide IB Means No Breakout
Strong information or volatility can create additional expansion even after a very large opening range.
6. Treating IB Extensions as Guaranteed Targets
0.5× or 1.0× levels are mathematical references. They are not promises that price will reach them.
7. Ignoring Acceptance
The most important information comes after the break. Is the market building business outside the range or immediately returning?
8. Ignoring Order-Flow Failure
Strong positive delta above IB High is not bullish if price cannot continue. Strong negative delta below IB Low is not bearish if sellers are being absorbed.
9. Mixing RTH and Overnight Data Without a Rule
Different session definitions produce different IB levels. Record the methodology explicitly.
10. Using Excessive Leverage
No Initial Balance structure eliminates futures risk. Breakouts can fail rapidly and slippage can occur in volatile conditions.
Pros and Limitations of Futures Initial Balance Trading
Pros
- Creates objective opening-session reference levels.
- Works across TPO, conventional charts and order-flow tools.
- Provides measurable range expansion.
- Can distinguish accepted from failed breakouts.
- Combines naturally with Auction Market Theory.
- Allows width to be normalized statistically across sessions.
Limitations
- The session/window definition must remain consistent.
- No IB width guarantees a particular day type.
- Extension multiples are not guaranteed targets.
- Breakouts can reverse immediately.
- Contract volatility changes over time.
- Order-flow confirmation can still produce false signals.
Best For
Futures Initial Balance Trading is best suited to intraday futures traders who want an objective opening-range framework and already understand market structure, Market Profile, volume or order-flow confirmation.
Not Ideal For
It is less useful for traders searching for a mechanical breakout system with fixed universal targets or anyone unwilling to standardize session definitions and test the setup over a meaningful sample.
Futures Initial Balance Trading FAQ
What is Futures Initial Balance Trading?
Futures Initial Balance Trading uses the opening-session price range—its high, low, midpoint and width—as a framework for evaluating later balance, breakout, rejection and range expansion.
What is the Initial Balance in futures?
The Initial Balance is the range of prices visited during the opening blocks of a Market Profile/TPO period. A common classic configuration uses two 30-minute periods, but modern TPO tools can allow the number of blocks to be configured.
What is IB High?
IB High is the highest price traded during the selected Initial Balance window.
What is IB Low?
IB Low is the lowest price traded during the selected Initial Balance window.
How do you calculate Initial Balance range?
Subtract IB Low from IB High. If IB High is 6,524.25 and IB Low is 6,510.75, the range is 13.50 points.
What is the Initial Balance midpoint?
The midpoint is calculated as (IB High + IB Low) ÷ 2 and represents the center of the opening range.
Does the Initial Balance always use the first hour?
The classic Market Profile framework commonly uses the first two 30-minute periods, but platform implementations and trader methodologies can be configurable. Use one consistent definition when testing.
Does a narrow Initial Balance predict a trend day?
No. A narrow IB can leave more room for expansion, but it does not guarantee a trend day. Relative width should be treated as context.
Does a wide Initial Balance mean price will stay inside it?
No. A wide opening range indicates substantial early movement, but later information can still produce additional range expansion.
What is an IB range extension?
An extension occurs when price trades beyond IB High or IB Low after the Initial Balance period has been established.
What is a failed Initial Balance breakout?
A failed breakout occurs when price extends beyond an IB boundary but cannot build acceptance and returns inside the original opening range.
What are 0.5× and 1.0× IB extensions?
They are mathematical projections based on a fraction or full multiple of the original IB width. They quantify range expansion but should not be treated as guaranteed targets.
How should IB width be compared across sessions?
A useful approach is to compare today’s IB with the median or percentile distribution of recent comparable sessions using the same contract and session definition.
Can Volume Delta confirm an IB breakout?
Volume Delta can show aggressive participation, but confirmation requires price response. Strong delta without progress may indicate absorption rather than continuation.
Can Initial Balance be combined with Market Profile?
Yes. The IB is a core TPO reference and can be analyzed alongside POC, VAH, VAL, single prints, poor highs/lows and developing profile distributions.
Can Futures Initial Balance Trading predict price direction?
No. Futures Initial Balance Trading provides an objective framework for measuring the opening auction and subsequent price behavior. It does not guarantee the direction or size of the next move.
Final Verdict: How to Use Futures Initial Balance Trading Correctly
Futures Initial Balance Trading is valuable because it converts the opening auction into a measurable structure rather than forcing traders to predict direction immediately after the market opens.
The essential levels are simple:
IB High → IB Low → IB Midpoint → IB Width.
The useful analysis begins afterward.
Does price remain balanced inside the range? Does it extend above or below? Does aggressive order flow support the extension? Does the market build time and volume outside the range? Does the old IB boundary hold on a retest, or does price fail back into the opening auction?
TradeboticsAI improves the traditional framework by normalizing IB width against recent comparable sessions instead of relying on fixed point thresholds that become obsolete as volatility changes.
The strongest process is:
consistent session → completed IB → relative width → boundary test → participation → acceptance/rejection → retest → risk.
Use Futures Initial Balance Trading alongside Futures Market Profile, Auction Market Theory, Single Prints, Volume Delta, Footprint Charts and Order Flow Trading.
The objective is not to guess whether the first hour predicts the entire session. It is to establish an objective opening framework and then let the subsequent auction prove whether balance, rejection or genuine price discovery is developing.
Explore NinjaTrader for futures charting, order flow and simulated trading
Affiliate Disclosure: TradeboticsAI may receive compensation when eligible users complete a qualifying action through certain affiliate links. Affiliate relationships do not determine our editorial conclusions.
Risk Disclosure: Futures trading involves substantial risk of loss and is not suitable for every investor. Initial Balance ranges, range extensions, TPO structures, Volume Delta, footprint patterns and historical auction behavior do not predict future returns. Narrow or wide Initial Balances do not guarantee specific day types, extension levels are not guaranteed targets, and simulated results do not guarantee future live performance. Nothing on this page is personalized investment, financial, tax or trading advice.