Futures Absorption Trading 2026: Footprint, Delta & Order Flow Guide
Futures Absorption Trading studies what happens when aggressive market orders hit a price repeatedly but fail to push through because passive limit liquidity continues to accept the flow. On a footprint chart, this often appears as heavy bid-side selling at a low or heavy ask-side buying at a high without proportional price progress. The important signal is not simply “big volume.” It is the relationship between aggressive volume, passive liquidity and the resulting price response. Absorption can help explain failed breakouts, defended levels and trapped traders, but it does not guarantee a reversal.
Quick Answer
Futures Absorption Trading looks for heavy aggressive buying or selling that is met by enough passive liquidity to stop price from continuing in the same direction. A common footprint clue is large one-sided volume or delta at an important level while price remains pinned or closes away from the extreme. Confirmation improves when the level holds, the opposing side begins to respond and order-flow tools such as Cumulative Delta, Time & Sales or DOM show that the aggressive side is losing effectiveness. Absorption is a market-behavior observation, not a guaranteed entry signal.
Explore NinjaTrader for footprint charts, Cumulative Delta and simulated futures order-flow analysis
Affiliate Disclosure: TradeboticsAI may earn compensation when an eligible user completes a qualifying action through an affiliate link, at no additional cost to the user. Affiliate relationships do not determine our editorial conclusions.
What Is Futures Absorption Trading?
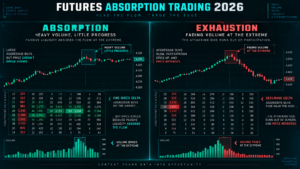
Futures Absorption Trading is an order-flow approach built around a simple observation: sometimes a large amount of aggressive buying or selling trades at a price, yet the market fails to continue in the direction of that aggression. When sellers repeatedly hit bids but the low does not break, passive buyers may be absorbing the selling. When buyers repeatedly lift offers but the high does not extend, passive sellers may be absorbing the buying.
NinjaTrader describes absorption on footprint or volumetric charts as large volume printing at a price level while price fails to move through that level. The platform’s educational material distinguishes this from ordinary candlestick analysis because footprint data shows bid and ask volume at individual prices inside the bar.
This makes Futures Absorption Trading an “effort versus result” framework. The effort is the aggressive transaction volume. The result is how far price actually travels. Heavy effort with little progress is the condition worth investigating.
Official reference:
NinjaTrader Footprint Charts Guide.
Futures Absorption Trading: Aggressive vs Passive Order Flow
To understand absorption, separate aggressive orders from passive orders. An aggressive buyer crosses the spread and trades against resting offers. An aggressive seller crosses the spread and trades against resting bids. Passive traders provide liquidity with limit orders waiting in the book.
In a centralized futures market, limit orders contribute to market depth and queue for execution according to the applicable matching rules. CME educational material explains that exchange-traded limit orders sit in the order book and their execution depends on both price and queue priority.
Suppose aggressive sellers execute 1,200 contracts into a bid around 6,500.00. If that price immediately collapses several ticks, the selling is producing progress. If 1,200 contracts trade and price remains pinned around 6,500.00, the same selling pressure is producing a very different result.
The second case is the foundation of Futures Absorption Trading. The trader is not trying to guess who the passive participant is. The observable fact is that one side keeps trading aggressively while the auction is failing to progress.
Official reference:
CME Group explanation of centralized limit-order execution.
How Futures Absorption Trading Looks on a Footprint Chart
A footprint chart is one of the clearest tools for Futures Absorption Trading because it organizes executed bid and ask volume at individual price levels. NinjaTrader calls its footprint-style chart Volumetric Bars.
Look for a cluster of evidence rather than one isolated number:
- Unusually heavy volume at an extreme: substantial bid-side volume near a low or ask-side volume near a high.
- Limited price progress: price repeatedly tests the level but does not continue cleanly through it.
- One-sided delta: the aggressive side can remain dominant even though price is not responding proportionally.
- Repeated prints: multiple bars or price rows show activity around the same defended area.
- Close away from the extreme: after heavy aggression, the bar begins to reject the level.
- Opposite-side response: subsequent order flow begins to confirm that the attacking side is losing control.
A common mistake is to treat a large delta number as absorption by itself. It is not. If aggressive selling is accompanied by a clean breakdown, the sellers are not being absorbed in a meaningful trading sense; they are successfully moving price. Futures Absorption Trading requires the mismatch between aggression and progress.
For the full footprint framework, see Futures Footprint Charts 2026.
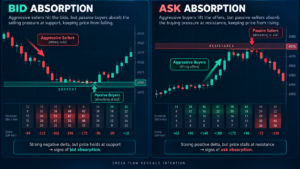
Bid Absorption vs Ask Absorption
Futures Absorption Trading can occur on either side of the market. The terminology is easier to understand when tied to the passive side doing the absorbing.
| Type | Aggressive Side | Passive Side | Typical Observation |
|---|---|---|---|
| Bid Absorption | Sellers hitting bids | Resting buyers | Heavy sell volume with limited downward progress |
| Ask Absorption | Buyers lifting offers | Resting sellers | Heavy buy volume with limited upward progress |
Bid absorption near a pre-defined support area can support a bullish hypothesis if price then rejects the low. Ask absorption near resistance can support a bearish hypothesis if the market begins rejecting the high.
But location and confirmation matter. Bid absorption in the middle of a random range may simply represent temporary two-way trade. Ask absorption during a strong trend can eventually be overwhelmed if buying remains persistent.
Futures Absorption Trading With Delta and Cumulative Delta
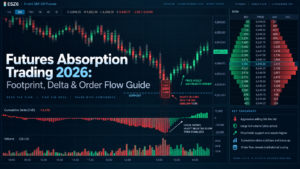
Delta is especially useful in Futures Absorption Trading because it measures aggressive imbalance. A common bid/ask convention calculates delta as ask-side traded volume minus bid-side traded volume.
Imagine ES makes a new session low while the bar prints strongly negative delta. That is not automatically bullish. If price keeps falling, the aggressive sellers are succeeding. The interesting condition appears when negative delta continues expanding while the low stops making meaningful progress.
Cumulative Delta can add a broader session view. If CVD continues declining while price stabilizes at a major support level, aggressive selling is still occurring but its marginal ability to push price lower may be weakening. That can support an absorption hypothesis.
The relationship can also work at a high. Strong positive delta or rising CVD combined with stalled price can indicate that aggressive buyers are repeatedly transacting into passive sell liquidity.
Do not use the sign of delta as the trade direction. In an absorption setup, the most useful information can be that delta is extremely one-sided against the eventual rejection direction.
For the broader running-delta framework, see Futures Cumulative Delta 2026.
Futures Absorption Trading vs Exhaustion
Absorption and exhaustion can both appear near market turning points, but they represent different mechanics.
| Feature | Absorption | Exhaustion |
|---|---|---|
| Aggressive Activity | Heavy | Fading or drying up |
| Passive Liquidity | Actively accepting flow | May not require large opposing absorption |
| Core Question | Why is heavy aggression failing? | Has the aggressive side run out of participation? |
| Footprint Clue | Large volume with poor progress | Volume thins near the extreme |
NinjaTrader’s footprint education makes the same distinction: absorption occurs when large volume fails to move through a level, while exhaustion occurs when one side’s aggressive activity fades at an extreme.
For Futures Absorption Trading, confusing these two conditions can distort risk decisions. An absorber can still be overrun by continued aggression. Exhaustion, by contrast, can reverse simply because the attacking side stops participating.
Iceberg Orders, Replenishment and Futures Absorption Trading
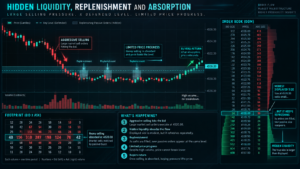
Some absorption events involve replenishing passive liquidity. A DOM may display only a modest bid, yet significantly more contracts trade there than were initially visible. One possible explanation is hidden or iceberg-style liquidity.
CME Market by Order data provides individual order-level information and greater queue transparency than aggregated Market by Price data. MBO can help compatible tools distinguish native order refresh behavior from a simple aggregated DOM snapshot.
Still, Futures Absorption Trading does not require proving that one specific iceberg order exists. The essential observation is that aggressive transactions are repeatedly being accepted without proportional price progress.
This distinction prevents overclaiming. Multiple independent limit orders, algorithmic replenishment or other liquidity-provision behavior can all contribute to an absorption-like footprint. The trader can observe the effect without pretending to know the identity or motive of the participant.
See Futures Iceberg Orders 2026 and Futures Level 2 Data 2026 for MBO, MBP and hidden-liquidity analysis.
Where Futures Absorption Trading Matters Most
Absorption becomes more useful when it occurs at a price that already matters for an independent reason. Watching every high-volume footprint cell across an entire session creates too many low-quality signals.
Useful locations can include:
- prior session high or low;
- Value Area High or Value Area Low;
- session or composite POC;
- VWAP or a defined VWAP band;
- Initial Balance extremes;
- overnight high or low;
- clear breakout or failed-breakout levels;
- high-volume or low-volume nodes;
- well-defined swing highs and lows.
This location-first approach is one reason Futures Absorption Trading works naturally with Futures Volume Profile 2026, Futures Market Profile 2026 and Futures VWAP 2026.
NinjaTrader also recommends reading footprint data around meaningful price structure rather than staring at raw volume in isolation.
TradeboticsAI Futures Absorption Trading Quality Score
TradeboticsAI uses the following editorial framework to separate high-information absorption from ordinary noisy order flow. It is not a mechanical trading system.
| Factor | Weak | Medium | Strong |
|---|---|---|---|
| Location | Random middle of range | Intraday reference | Major pre-defined auction level |
| Aggressive Volume | Ordinary | Clearly elevated | Extreme relative to nearby activity |
| Price Progress | Aggression moves price normally | Progress slows | Repeated aggression produces almost no progress |
| Persistence | One print | Several tests | Repeated defense across multiple executions |
| Confirmation | No rejection | Initial response | Opposite-side flow + price rejection |
The information gain is that Futures Absorption Trading should be graded across multiple dimensions. Heavy volume without location is weaker. A great location without meaningful aggression is not absorption. Strong aggression without rejection may simply be a breakout in progress.
Practical Futures Absorption Trading Example: ES
Consider a hypothetical ES session where prior-day VAL is 6,500.00. Price sells down from 6,512.00 and reaches that pre-defined level.
The footprint shows the following sequence:
- At 6,500.25, 620 contracts trade on the bid versus 180 on the ask.
- At 6,500.00, another 840 contracts trade on the bid versus 205 on the ask.
- The next bar retests 6,500.00 with strongly negative delta.
- Despite the selling, ES does not trade sustainably below 6,499.75.
- The following bar closes back above 6,502.00 as ask-side volume increases.
The important observation is not that selling disappeared. Sellers were extremely aggressive. The important observation is that their effort produced little additional downside.
This is a higher-quality Futures Absorption Trading candidate because several independent factors align: a pre-defined location, heavy aggressive selling, limited progress, repeated defense and an opposite-side response.
A risk-controlled trader still needs an invalidation point. If the thesis depends on the 6,500.00 area holding, a clean break and acceptance below the absorbed extreme would invalidate the setup. The footprint does not remove the need for position sizing or a stop plan.
For live transaction confirmation, use Futures Time and Sales 2026. For visible passive liquidity, use Futures DOM Trading 2026.
Why Futures Absorption Trading Setups Fail
1. The Passive Liquidity Gets Overrun
A buyer can absorb thousands of contracts and still be overwhelmed by continued selling. Genuine absorption is not guaranteed to hold indefinitely.
2. The Resting Liquidity Is Pulled
Displayed passive orders can be canceled. If the defended liquidity disappears, the original interpretation may no longer be valid.
3. The Signal Appears in a Poor Location
High volume with limited progress in the middle of a balanced range may simply reflect normal two-way trade rather than a meaningful defense.
4. News Reprices the Market
Economic releases, central-bank events or unexpected headlines can overwhelm previously meaningful order-flow structure.
5. One Participant Is Exiting Rather Than Defending
A large passive execution can resemble absorption without implying that the participant intends to defend the level after completing the trade.
6. The Trader Enters Before Confirmation
Heavy aggression can remain heavy for much longer than expected. Entering solely because the first absorption-like print appears can result in trading directly against a developing breakout.
The practical conclusion is that Futures Absorption Trading needs a resolution condition. The level either holds and produces a response, or it does not.
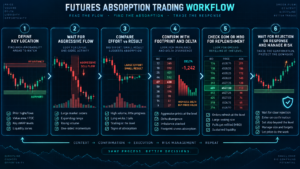
A Practical Futures Absorption Trading Workflow
- Confirm the active contract. Order-flow analysis should use the contract carrying relevant liquidity.
- Define key locations before the signal. Use prior highs/lows, VWAP, Volume Profile or Market Profile references.
- Wait for aggressive flow. Absorption requires meaningful market-order pressure into the level.
- Measure price progress. Ask whether the aggression is actually moving the market.
- Check footprint structure. Look for large bid/ask volume, delta and repeated activity at the extreme.
- Use CVD for broader context. Determine whether session-level aggression is diverging from price.
- Inspect DOM or MBO if available. Replenishment can strengthen the passive-liquidity hypothesis.
- Wait for confirmation. Opposite-side aggression, rejection or reclaim of the level can improve signal quality.
- Define invalidation. A clean break through the defended area should force reassessment.
- Review in simulation or replay. Build a dataset of successful and failed examples instead of relying on memory.
Explore NinjaTrader for Volumetric Bars, Cumulative Delta and futures simulation
Data, Platform and Cost Requirements
Futures Absorption Trading depends on detailed transaction data. A standard OHLC candlestick cannot reveal bid-versus-ask volume at each price. Traders typically use footprint or volumetric charts plus real-time exchange data.
NinjaTrader’s Order Flow+ tools include Volumetric Bars and other order-flow analytics. Access terms, exchange-data subscriptions and platform pricing can change, so verify current availability directly with the provider before purchasing a plan specifically for this workflow.
Potential costs or requirements include:
- real-time exchange market data;
- a platform supporting footprint or volumetric bars;
- optional market-depth or MBO data;
- order-flow add-ons or advanced platform plans;
- adequate computer performance for high-resolution data;
- time spent learning the instrument’s normal volume behavior.
TradingView and other platforms can provide volume-based approximations or footprint-style tools depending on the data source, but traders should understand the exact methodology. A candle-derived estimate of buy/sell pressure is not automatically equivalent to exchange-classified bid/ask execution.
Pros and Limitations of Futures Absorption Trading
Pros
- Compares aggressive volume with actual price response.
- Can identify defended levels invisible on standard candles.
- Works naturally with footprint, CVD and DOM analysis.
- Provides clear structural invalidation when the defended level breaks.
- Useful for failed-breakout and reversal research.
- Encourages location-first order-flow analysis.
Limitations
- Absorbing liquidity can eventually be overwhelmed.
- Displayed orders can be canceled.
- Data methodology differs between platforms.
- High-volume two-way trade can resemble absorption.
- News can invalidate microstructure signals quickly.
- Reading footprints in real time has a significant learning curve.
Best For
Futures Absorption Trading is best suited to active futures traders who already understand market structure and want more detail around reversals, failed breakouts, support/resistance tests and intraday execution.
Not Ideal For
It is less suitable for traders who want a mechanical indicator that produces automatic long/short signals, or for longer-term participants who do not need price-level transaction detail.
Futures Absorption Trading FAQ
What is Futures Absorption Trading?
Futures Absorption Trading is the analysis of situations where aggressive market orders trade heavily into passive limit liquidity but fail to produce proportional price movement.
What does absorption look like on a footprint chart?
Common clues include large bid or ask volume at an extreme, one-sided delta, repeated testing of the same price and limited continuation despite aggressive trading.
What is bid absorption?
Bid absorption occurs when aggressive sellers repeatedly hit resting bids but passive buyers accept the flow and limit further downside progress.
What is ask absorption?
Ask absorption occurs when aggressive buyers repeatedly lift resting offers but passive sellers absorb the buying and limit further upside progress.
Is absorption the same as exhaustion?
No. Absorption involves heavy aggressive activity that fails to move price. Exhaustion involves aggressive activity fading or disappearing near an extreme.
Does negative delta at a low mean bullish absorption?
Not by itself. Negative delta can simply confirm strong selling. It becomes more relevant to Futures Absorption Trading when selling remains heavy but price stops making meaningful downside progress and then rejects the level.
Can an iceberg order cause absorption?
Yes. Hidden or replenishing passive liquidity can contribute to absorption. However, absorption can be observed from the transaction and price response without proving that one specific iceberg exists.
Is absorption a reversal signal?
It can support a reversal hypothesis, but it does not guarantee one. Passive liquidity can be overwhelmed and the market can eventually break through the level.
Where is absorption most useful?
It is generally more useful at pre-defined levels such as prior highs/lows, VWAP, VAH, VAL, POC, Initial Balance boundaries and clear breakout areas.
What tools are best for absorption trading?
Footprint charts are the primary tool. Cumulative Delta, DOM, Level 2 data, Time & Sales and Volume Profile can provide complementary evidence.
Can beginners use absorption trading?
They can study it, but the technique is easier to misuse without a solid understanding of futures order types, tick values, market depth and risk management.
Does NinjaTrader support absorption analysis?
Yes. NinjaTrader’s Volumetric Bars display bid/ask volume and delta at individual price levels, and NinjaTrader educational material explicitly discusses absorption and exhaustion as footprint patterns. Verify current Order Flow+ access terms directly with NinjaTrader.
Final Verdict: How to Use Futures Absorption Trading Correctly
Futures Absorption Trading is valuable because it focuses on a relationship most ordinary indicators hide: how much aggressive effort entered the market versus how much price movement that effort actually produced.
Heavy selling that easily drives price lower is not a bullish absorption setup. Heavy buying that easily drives price higher is not bearish absorption. The interesting condition appears when aggressive traders keep paying for immediacy while passive liquidity prevents meaningful progress.
The strongest setup combines a pre-defined market location, unusually strong aggressive volume, poor price progress, persistence and a subsequent rejection or opposite-side response. Footprint charts provide the detail, Cumulative Delta broadens the context, DOM and MBO can reveal replenishment, and Time & Sales confirms what actually traded.
Use Futures Absorption Trading as a structured order-flow observation—not as proof that a market must reverse. When the defended level breaks cleanly, the thesis has changed and the trader must change with it.
Explore NinjaTrader for footprint charts, Order Flow+ tools and futures simulation
Affiliate Disclosure: TradeboticsAI may receive compensation when eligible users complete a qualifying action through certain affiliate links. Affiliate relationships do not determine our editorial conclusions.
Risk Disclosure: Futures trading involves substantial risk of loss and is not suitable for every investor. Absorption, delta, footprint patterns, Cumulative Delta, DOM behavior and hidden-liquidity analysis do not predict future returns. Passive liquidity can be canceled or overwhelmed, and simulated results do not guarantee future live performance. Nothing on this page is personalized investment, financial, tax or trading advice.