Futures Order Flow Trading 2026: Footprint, DOM, CVD & Strategy Guide
Futures Order Flow Trading studies how actual transactions and resting liquidity interact inside the futures market rather than looking only at completed price bars. The approach combines tools such as footprint charts, Cumulative Delta, Time & Sales, Depth of Market, Level 2 data, Volume Profile and VWAP to answer a practical question: what are buyers and sellers actually doing at the prices that matter? The strongest order-flow process does not treat one indicator as a signal. It combines market location, executed volume, resting liquidity, price response and predefined risk.
Quick Answer
Futures Order Flow Trading analyzes executed trades and visible liquidity to understand short-term buying and selling pressure. Footprint charts show bid/ask volume at each price, Cumulative Delta tracks aggressive pressure over time, the DOM shows resting liquidity, Time & Sales shows completed transactions, and Volume Profile or VWAP provides location. The highest-quality setups usually occur when several layers agree at a meaningful level. Order flow can improve context and execution timing, but it does not predict price reliably and should not replace position sizing, invalidation or risk management.
Explore NinjaTrader for footprint charts, Cumulative Delta, market depth and futures simulation
Affiliate Disclosure: TradeboticsAI may earn compensation when an eligible user completes a qualifying action through an affiliate link, at no additional cost to the user. Affiliate relationships do not determine our editorial conclusions.

What Is Futures Order Flow Trading?
Futures Order Flow Trading is the analysis of the transactions and limit-order activity that create price movement in exchange-traded futures. Standard candlestick charts summarize open, high, low and close. Order-flow tools go deeper by showing how much traded at the bid and ask, how aggressive pressure accumulated, where liquidity was displayed and whether that pressure actually moved price.
NinjaTrader describes order flow as analyzing actual buy and sell volume executed at each price level rather than relying on price alone. Its Order Flow+ toolset includes Volumetric Bars, Cumulative Delta, Volume Profile, VWAP and market-depth tools.
That distinction matters because identical-looking candles can be created by very different underlying activity. A bullish candle can form with strong aggressive buying and clean continuation, or it can form after heavy selling was absorbed by passive buyers. The candle records the outcome; order flow helps explain the path.
For TradeboticsAI, Futures Order Flow Trading is best treated as a multi-layer decision framework rather than as one indicator. The objective is to answer three questions: where is the market, who is acting aggressively, and is that aggression producing price progress?
Official reference:
NinjaTrader Order Flow Trading.
Why Futures Order Flow Trading Fits Centralized Futures Markets
Exchange-traded futures are especially useful for order-flow analysis because transactions and order-book activity are organized through centralized exchange infrastructure. CME describes its central limit order book as a repository for currently unmatched orders, with passive participants supplying liquidity and aggressive participants demanding liquidity by trading against the book.
This structure gives Futures Order Flow Trading a defined source for bid/ask transactions, volume and market-depth information. That does not make every platform display identical—data feeds, aggregation methods and settings still matter—but the underlying exchange-traded environment is more transparent than fragmented markets where activity is split across many venues.
CME Market by Order data can provide individual queue position, full depth of book and individual order sizes while maintaining participant anonymity. Market by Price instead aggregates quantity at price levels. These distinctions matter when traders analyze queue position, hidden liquidity or order-book behavior.
Official reference:
CME Group Market by Order FAQ.
Futures Order Flow Trading: Executed Flow vs Resting Liquidity
A major source of confusion is mixing executed transactions with resting orders. Futures Order Flow Trading works better when these layers remain separate.
| Layer | Examples | What It Tells You | Main Limitation |
|---|---|---|---|
| Executed Flow | Footprint, Time & Sales, Delta, CVD | What actually traded | Describes completed activity, not all resting intent |
| Resting Liquidity | DOM, Level 2, MBO/MBP | Where bids and offers are currently displayed | Orders can be modified or canceled |
| Location | VWAP, Volume Profile, Market Profile | Where current activity is occurring relative to meaningful references | Does not independently identify trade direction |
A large bid in the DOM is not the same thing as heavy buying. The bid is passive liquidity waiting to trade. Aggressive selling may hit that bid. If the bid replenishes and price refuses to fall, the interaction becomes interesting. If the bid disappears before contact, the earlier display should receive less weight.
This separation between resting liquidity, executed flow and price response is one of the most important concepts in the entire order-flow cluster.

The Core Futures Order Flow Trading Tool Stack
The best tool depends on the question being asked. Futures Order Flow Trading becomes clearer when each tool has a specific job.
| Tool | Primary Question | Best Use |
|---|---|---|
| Footprint / Volumetric Bars | Where did aggressive buying and selling occur inside the bar? | Imbalance, absorption, exhaustion, trapped traders |
| Cumulative Delta | Is aggressive pressure building or diverging from price? | Trend confirmation and divergence |
| DOM / Level 2 | Where is visible liquidity resting now? | Short-term execution, depth, queue behavior |
| Time & Sales | What is actually executing right now? | Tape speed, print size, aggressor activity |
| Volume Profile | Where did the most volume trade? | POC, VAH, VAL, HVN/LVN location |
| VWAP | Where is the volume-weighted average since reset? | Session benchmark and relative location |
The mistake is opening every tool and reacting to every number. A cleaner Futures Order Flow Trading workflow starts with location, then uses one or two execution tools to answer a specific question.

Footprint Charts and Delta in Futures Order Flow Trading
Footprint charts display bid and ask volume at each individual price level within a bar. NinjaTrader calls these Volumetric Bars. They reveal information a standard candle does not show, including where one side was more aggressive, where volume concentrated and whether price responded to that aggression.
Delta is commonly calculated as ask-side traded volume minus bid-side traded volume. Positive delta means more volume executed aggressively at the ask under the chosen classification; negative delta means more executed at the bid.
The critical point is that delta shows aggression, not guaranteed control. Strong positive delta at a high can accompany a successful breakout, or it can appear while passive sellers absorb buying and price stalls. Strong negative delta at a low can accompany continuation, or it can reveal sellers becoming trapped if price refuses to move lower.
This is why Futures Order Flow Trading should compare aggression with result rather than simply treating positive delta as bullish and negative delta as bearish.
See Futures Footprint Charts 2026 and Futures Absorption Trading 2026 for deeper examples.
Cumulative Delta in Futures Order Flow Trading
Cumulative Delta takes delta beyond a single bar by maintaining a running total over the selected period. It can help show whether aggressive pressure is confirming or disagreeing with price.
If price rises while CVD also rises, aggressive buying broadly confirms the advance. If price makes a higher high while CVD makes a lower high, the two are diverging. That disagreement can justify deeper investigation, but it does not guarantee reversal.
NinjaTrader explicitly warns that Cumulative Delta can produce false signals. For Futures Order Flow Trading, the strongest use is therefore contextual: locate the divergence at a meaningful level, inspect the footprint around that location and require price response before treating it as actionable.
See Futures Cumulative Delta 2026 for session resets, divergence and calculation details.
DOM, Level 2 and Time & Sales in Futures Order Flow Trading
The DOM and tape form a natural pair. The DOM shows what is currently resting; Time & Sales shows what has actually executed. Futures Order Flow Trading becomes more reliable when the trader compares the two instead of assuming displayed size equals committed liquidity.
A large offer can look like resistance. If buyers trade into it and the order remains or replenishes while price stalls, passive selling may be absorbing demand. If the offer disappears before buyers reach it, the earlier depth did not provide durable resistance. If buyers consume the offer and price accepts above it, the market has resolved the liquidity in another way.
Level 2 data adds depth beyond the best bid and ask. CME MBO can expose individual anonymous orders, queue information and full depth where supported, while MBP consolidates quantity by price.
Use Futures DOM Trading 2026, Futures Level 2 Data 2026 and Futures Time and Sales 2026 for dedicated explanations.
Volume Profile, Market Profile and VWAP as Order Flow Location
Order flow has more value when the trader knows where to pay attention. Volume Profile, Market Profile and VWAP provide that location layer.
Volume Profile identifies where volume traded across price and creates references such as POC, VAH and VAL. Market Profile organizes the auction through time-at-price and TPO structure. VWAP calculates a volume-weighted reference from a chosen reset point.
A footprint imbalance in the middle of random rotation can be low value. The same imbalance at prior VAL after a failed downside auction can be more informative because the market is interacting with a pre-defined reference.
For Futures Order Flow Trading, location reduces noise. Instead of reading every footprint cell, the trader waits for the auction to reach an area that matters and then examines how participants behave there.
See Futures Volume Profile 2026, Futures Market Profile 2026 and Futures VWAP 2026.
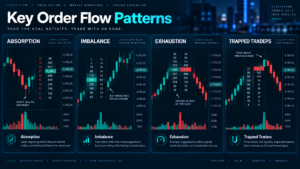
Four Core Futures Order Flow Trading Patterns
1. Imbalance
Imbalance occurs when aggressive volume on one side substantially outweighs the opposing side at a price level. A sequence of imbalances can support continuation when price responds in the same direction.
2. Absorption
Absorption occurs when aggressive trading is heavy but price fails to make proportional progress. Heavy selling at a low with no breakdown can indicate passive buyers are accepting the flow; heavy buying at a high with no breakout can indicate passive sellers.
3. Exhaustion
Exhaustion describes aggressive participation fading near an extreme. Unlike absorption, the key feature is not heavy aggression being stopped but the attacking side running out of activity.
4. Trapped Traders
A trapped-trader pattern occurs when one side enters aggressively but the market quickly moves against them. A large positive-delta push above resistance that fails and closes back below can leave late buyers under pressure.
NinjaTrader educational material identifies imbalance, absorption and exhaustion as common footprint patterns. In Futures Order Flow Trading, these patterns should be treated as hypotheses requiring location and confirmation rather than automatic entries.
TradeboticsAI Futures Order Flow Trading Framework
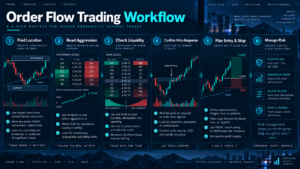
TradeboticsAI uses a five-layer framework designed to prevent indicator stacking without purpose.
| Layer | Question | Typical Tools |
|---|---|---|
| 1. Location | Why does this price matter? | VWAP, Volume Profile, Market Profile, prior highs/lows |
| 2. Aggression | Which side is crossing the spread? | Footprint, Delta, Time & Sales |
| 3. Liquidity | What passive liquidity is available? | DOM, Level 2, MBO/MBP |
| 4. Response | Is aggression producing price progress? | Price structure, footprint, CVD |
| 5. Risk | Where is the thesis invalidated? | Stop logic, position sizing, max loss |
The framework’s main information gain is that every tool must answer a different question. If two indicators are merely displaying the same underlying information in different colors, adding both does not necessarily improve the decision.
Practical Futures Order Flow Trading Example: ES Failed Breakdown
Consider a hypothetical ES session with prior-day VAL at 6,500.00. Price trades down from 6,512.00 and reaches the level during the U.S. session.
First, the location is meaningful because VAL was defined before the trade. Second, the footprint begins showing heavy bid-side volume at 6,500.25 and 6,500.00. Delta becomes strongly negative, showing aggressive sellers are active.
Third, price fails to progress. Several hundred additional contracts execute at the bid, yet ES cannot remain below 6,499.75. The DOM shows bids replenishing near the level, and Time & Sales confirms repeated selling into those bids.
Fourth, Cumulative Delta makes a new session low while price stops making new lows. The divergence does not create the trade by itself, but it reinforces the idea that aggressive selling is becoming less effective.
Finally, price trades back above 6,502.00 and the footprint begins showing ask-side activity. At this point the Futures Order Flow Trading thesis has progressed from location → aggressive selling → absorption → failed progress → opposite-side response.
A trader still needs a risk plan. If the hypothesis is based on the 6,500.00 area holding, sustained acceptance below the absorbed low would invalidate the setup. The example demonstrates how multiple tools can support one coherent idea instead of producing unrelated signals.
A Practical Futures Order Flow Trading Strategy Workflow
- Confirm the active contract. Use the expiration carrying the relevant volume and liquidity.
- Define location before the signal. Mark prior highs/lows, VWAP, VAH, VAL, POC, Initial Balance or other objective references.
- Choose one primary execution tool. Use footprint, DOM or tape rather than reacting to every possible indicator.
- Measure aggression. Determine whether buyers or sellers are crossing the spread aggressively.
- Compare effort with result. Ask whether that aggression is actually producing price progress.
- Check broader confirmation. CVD, Volume Profile or another independent layer can support or contradict the hypothesis.
- Wait for resolution. Look for acceptance, rejection, breakout, absorption or failure rather than entering from one isolated print.
- Define invalidation. Identify the price or structural condition that proves the setup wrong.
- Size the position from risk. Order flow should improve timing, not justify excessive leverage.
- Review in replay or simulation. Save screenshots of both successful and failed setups and compare the sequence objectively.
This workflow keeps Futures Order Flow Trading grounded in observable behavior. The purpose is not to forecast every tick; it is to improve the quality of decisions at important moments.
Explore NinjaTrader Order Flow+ and practice futures analysis in simulation
Data and Platform Requirements for Futures Order Flow Trading
High-quality Futures Order Flow Trading depends on market data and platform methodology. A standard OHLC chart is not enough to reconstruct every bid/ask interaction. Detailed footprint, DOM and queue analysis may require real-time exchange data, market-depth subscriptions and software that supports the relevant visualization.
Before choosing a platform, verify:
- real-time vs delayed futures data;
- bid/ask trade classification;
- footprint or volumetric chart support;
- Cumulative Delta methodology;
- DOM and Level 2 depth;
- MBO vs MBP availability;
- historical market-depth or replay support;
- session templates and reset rules;
- platform or add-on pricing;
- simulation support for practice.
NinjaTrader’s current Order Flow+ page lists footprint charts, Cumulative Delta, Volume Profile, VWAP and market-depth tools as part of its order-flow feature set. Product packaging and pricing can change, so verify current access directly before purchasing a plan specifically for these features.
For platform comparison rather than trading methodology, see Best Order Flow Trading Platforms 2026.
Common Futures Order Flow Trading Mistakes
1. Using Too Many Tools
More indicators do not automatically create more information. Each tool should answer a distinct question.
2. Treating Delta as Direction
Positive delta does not guarantee higher prices and negative delta does not guarantee lower prices. Aggression can be absorbed.
3. Ignoring Location
Order flow in the middle of random rotation can be noisy. Pre-defined market references make the same data more useful.
4. Confusing Resting Orders With Executed Volume
The DOM shows visible liquidity. Time & Sales and footprints show completed transactions. Those are different information layers.
5. Trading Every Divergence
CVD divergence can persist for long periods. A divergence should trigger investigation, not an automatic reversal order.
6. Believing Every Large DOM Order
Displayed orders can be canceled. Wait for persistence, execution and price response.
7. Ignoring Data Methodology
Different feeds and platforms can calculate or display order-flow information differently. Document the setup before comparing results.
8. Skipping Risk Management
Futures Order Flow Trading can refine timing but cannot remove the substantial risk of futures trading.
Pros and Limitations of Futures Order Flow Trading
Pros
- Shows more detail than standard candles alone.
- Separates aggressive transactions from passive liquidity.
- Can improve analysis around support, resistance and breakouts.
- Useful for studying absorption, exhaustion and trapped traders.
- Combines naturally with VWAP and profile-based location.
- Can improve execution awareness for active futures traders.
Limitations
- Does not reliably predict future price direction.
- Detailed data and tools may add cost.
- Fast-moving information has a steep learning curve.
- Platform methodologies can differ.
- Displayed liquidity can change or disappear.
- Over-analysis can lead to hesitation or overtrading.
Best For
Futures Order Flow Trading is best suited to intraday traders, scalpers and active execution-focused traders who benefit from price-level transaction detail and can make decisions without reacting impulsively to every update.
Not Ideal For
It is less useful for traders who hold positions for weeks and do not need second-by-second information, or for anyone searching for a mechanical indicator that guarantees entries and exits.
Futures Order Flow Trading FAQ
What is Futures Order Flow Trading?
Futures Order Flow Trading analyzes executed transactions and resting liquidity to understand how buyers and sellers are interacting at specific futures prices.
What is the best order flow tool for futures?
There is no single best tool. Footprint charts are useful for bid/ask volume by price, CVD for broader aggressive pressure, DOM for resting liquidity, Time & Sales for actual prints, and VWAP or Volume Profile for location.
What is a footprint chart?
A footprint chart displays bid and ask volume at individual price levels inside each bar. NinjaTrader calls footprint charts Volumetric Bars.
What is order flow delta?
Delta commonly measures ask-side traded volume minus bid-side traded volume. It describes aggressive transaction imbalance rather than guaranteed directional control.
What is Cumulative Delta?
Cumulative Delta is the running accumulation of delta over a selected period. Traders often compare CVD with price to evaluate confirmation or divergence.
Is DOM the same as order flow?
No. DOM is one order-flow tool focused primarily on resting market depth. Futures Order Flow Trading can also include footprints, CVD, tape, profiles and other transaction-based tools.
Can order flow predict futures prices?
No tool predicts price reliably. Order flow can provide context about aggression, liquidity, acceptance and rejection, but futures outcomes remain uncertain.
What is absorption in futures order flow?
Absorption occurs when aggressive buying or selling trades heavily into passive liquidity but fails to produce proportional price progress.
What is exhaustion?
Exhaustion occurs when aggressive participation fades near an extreme. It differs from absorption, where aggressive activity remains heavy but is being met by passive liquidity.
Is Futures Order Flow Trading good for beginners?
Beginners can learn it, but they should first understand contract specifications, tick values, order types, position sizing and basic market structure. Simulation can help build familiarity before risking live capital.
Does NinjaTrader support order flow tools?
Yes. NinjaTrader currently documents Volumetric Bars, Cumulative Delta, Volume Profile, VWAP, market-depth tools and other Order Flow+ features. Verify current packaging and pricing directly with NinjaTrader.
Which futures are best for order flow analysis?
Order-flow tools are generally easier to study in actively traded exchange-listed contracts with reliable transaction and depth data. The best contract depends on the trader’s strategy, risk tolerance, session and data access rather than a universal ranking.
Final Verdict: How to Use Futures Order Flow Trading Correctly
Futures Order Flow Trading is most useful when it explains the interaction between price, aggressive transactions and passive liquidity. It should not become a contest to display the largest number of indicators.
The core process is straightforward: first identify a meaningful location. Then determine which side is acting aggressively. Observe whether resting liquidity is accepting or disappearing. Finally, judge the result through acceptance, rejection, continuation or failure.
Footprint charts provide price-level transaction detail. Cumulative Delta gives broader aggressive-flow context. DOM and Level 2 show resting liquidity. Time & Sales confirms executed trades. Volume Profile, Market Profile and VWAP explain where those events are occurring.
When these tools tell one coherent story, the trader has more information than a standard candle alone can provide. When they conflict, the correct action may simply be to wait.
Use Futures Order Flow Trading to improve context, execution and risk-defined decision making—not to create certainty where the market offers none.
Explore NinjaTrader for footprint charts, market depth and futures simulation
Affiliate Disclosure: TradeboticsAI may receive compensation when eligible users complete a qualifying action through certain affiliate links. Affiliate relationships do not determine our editorial conclusions.
Risk Disclosure: Futures trading involves substantial risk of loss and is not suitable for every investor. Order flow, footprint charts, delta, Cumulative Delta, DOM depth, Level 2 data, absorption, imbalance and historical transaction patterns do not predict future returns. Displayed liquidity can change or disappear rapidly, and simulated results do not guarantee future live performance. Nothing on this page is personalized investment, financial, tax or trading advice.