Futures Poor Highs and Poor Lows 2026: TPO, Excess & Unfinished Auction Guide
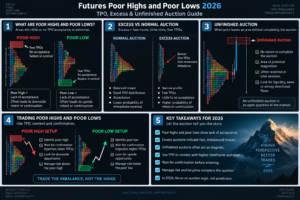
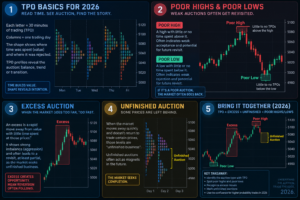
Futures Poor Highs and Poor Lows are Market Profile structures found at session extremes where the TPO profile ends without the clear tapering or rejection normally associated with excess. A poor high commonly appears as a relatively flat top containing multiple TPO blocks at the highest price area; a poor low is the mirror image at the bottom. Traders often describe these structures as unfinished auctions because the market stopped extending without producing a decisive rejection. The important point is not to assume price must return. Poor extremes are references that require context, auction structure and confirmation.
Quick Answer
Futures Poor Highs and Poor Lows are TPO profile extremes containing more than one TPO block and lacking the characteristic taper associated with stronger rejection. They suggest that the directional auction stopped without clearly proving that prices above a poor high—or below a poor low—were decisively rejected. Traders often monitor these levels for future range exploration or repair, but a revisit is not guaranteed. The strongest analysis combines the TPO structure with prior value, trend context, Volume Profile, footprint data and the market’s behavior when the level is approached again.
Explore NinjaTrader for futures order flow, market-depth analysis and simulation
Affiliate Disclosure: TradeboticsAI may earn compensation when an eligible user completes a qualifying action through an affiliate link, at no additional cost to the user. Affiliate relationships do not determine our editorial conclusions.
What Are Futures Poor Highs and Poor Lows?
Futures Poor Highs and Poor Lows belong to Time Price Opportunity analysis, commonly called TPO or Market Profile. TPO divides a trading period into time blocks and records which price rows were visited during each block.
TradingView’s current TPO documentation defines poor highs and poor lows as extreme levels containing more than one TPO block. The profile terminates with a comparatively flat, narrow top or bottom rather than showing the characteristic taper associated with stronger rejection.
ProRealTime similarly describes poor highs and poor lows as situations where one end of the Market Profile contains several boxes around the highest or lowest price zone and associates them with potentially unfinished auctions.
This definition is important because online explanations are often contradictory. Some articles incorrectly describe a single isolated TPO at an extreme as a poor high or poor low. In the TPO framework used on this page, the distinguishing feature is the opposite: multiple TPO blocks remain at the extreme and a clean excess-style taper is absent.
CME Group defines Market Profile more broadly as an analytical tool organizing price and time to help identify where price is being accepted or rejected. That acceptance-versus-rejection framework is the foundation for interpreting Futures Poor Highs and Poor Lows.
TPO Anatomy of Futures Poor Highs and Poor Lows
To understand Futures Poor Highs and Poor Lows, first understand what a TPO block represents. A profile divides the session into time brackets—commonly 30 minutes—and marks every price row visited during each bracket.
If the market repeatedly trades around one price, that row accumulates several TPO letters or blocks. If price moves rapidly through an area and does not return during subsequent brackets, fewer TPOs appear there.
A simplified profile might look like this:
Poor High Example

6525.00     JK
6524.75     HIJK
6524.50     GHIJK
6524.25     FGHIJK
6524.00     EFGHIJK
6533.75     DEFGHI
The exact letters are not important. What matters is that the highest row contains multiple TPOs rather than a clean taper to a single-block extreme.
The same logic inverted at the bottom creates a poor low.
Different platforms can use different row sizes, session definitions and time-block settings. A structure visible with one-tick rows can look different when several ticks are grouped into one row. For this reason, Futures Poor Highs and Poor Lows should always be evaluated with a standardized TPO configuration.
How a Futures Poor High Forms
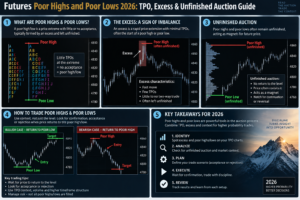
A poor high forms when an upward auction reaches its session extreme but does not produce clear excess. The highest area remains populated by multiple TPO blocks, suggesting that price spent enough time there for more than one time bracket to participate.
Conceptually, the sequence can be:
- price auctions higher;
- buyers continue extending the session range;
- the market reaches the eventual session high;
- more than one TPO period trades at or very near that extreme;
- the session stops extending without a sharp tapered rejection.
This does not prove that sellers are weak, nor does it prove price must trade higher next session. It indicates only that the profile did not finish with the type of excess traders normally associate with decisive rejection.
For Futures Poor Highs and Poor Lows, that nuance matters. A poor high is not automatically resistance. In fact, many auction-market traders monitor it specifically because the market may eventually explore above it.
How a Futures Poor Low Forms
A poor low is the mirror image. A downward auction reaches its lowest area, but multiple TPO blocks remain at the extreme instead of producing a sharply tapered bottom.
The sequence can look like:
- price auctions lower;
- sellers continue extending the range;
- the market reaches the eventual session low;
- several TPO periods interact with the lowest region;
- the session ends or rotates higher without strong excess at the extreme.
Again, the profile is describing structure, not making a prediction. Futures Poor Highs and Poor Lows can remain untouched for an extended period, be revisited and rejected, or be broken as the market continues price discovery.
The useful question is not “when must the poor low be filled?” It is “what does the market do when it eventually approaches that unfinished extreme again?”
Futures Poor Highs and Poor Lows vs Excess
The most important comparison is between a poor extreme and an extreme showing meaningful excess.
| Feature | Poor High / Poor Low | Excess / Completed-Looking Extreme |
|---|---|---|
| Profile Shape | Flat or narrow termination | Tapered extreme or tail |
| TPOs at Extreme | More than one block | Clear reduction toward the final extreme |
| Auction Interpretation | No decisive rejection visible | Stronger evidence of rejection |
| Future Use | Monitor for further exploration or repair | Monitor as previously rejected auction extreme |
| Guaranteed Outcome? | No | No |
Excess should not be treated as permanent support or resistance either. A market can later revisit and trade through a previously rejected area when information or participation changes.
The analytical value is comparative: Futures Poor Highs and Poor Lows show less evidence of completed rejection than a well-tapered extreme.
Poor Highs and Poor Lows vs TPO Single Prints
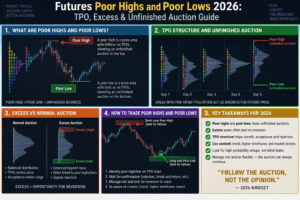
Single prints and poor extremes are also frequently confused.
TradingView defines single prints as non-extreme profile levels containing only one TPO block. They occur when price passes through an area during one time bracket and does not revisit it during the rest of that profile.
A poor high or poor low occurs at an extreme and contains multiple blocks at the extreme area.
| Structure | Location | TPO Character |
|---|---|---|
| Poor High / Low | Profile extreme | Multiple TPOs with weak taper |
| Single Print | Inside the profile, away from final extreme | One TPO period traversed the level |
This distinction is essential for correctly interpreting Futures Poor Highs and Poor Lows and prevents several common Market Profile labeling errors.
What “Unfinished Auction” Means for Futures Poor Highs and Poor Lows
Market Profile traders often call Futures Poor Highs and Poor Lows unfinished auctions because the extreme lacks a clear visual rejection.
The phrase should not be interpreted as a rule that forces price to revisit the level within a specific number of hours or sessions. Markets do not have an obligation to “repair” a profile according to a trader’s schedule.
A more precise interpretation is:
The profile stopped extending before displaying strong evidence that the auction was decisively rejected at the extreme.
That can leave the area interesting for future range exploration. TradingView’s current documentation notes that poor highs and lows suggest the market may not have fully explored prices beyond the profile extreme, potentially leaving room for additional movement.
This makes Futures Poor Highs and Poor Lows contextual reference points, not guaranteed targets.
How to Read a Retest of Futures Poor Highs and Poor Lows
The future retest is where the structure becomes actionable. When price approaches an old poor extreme, do not automatically fade it and do not automatically predict a breakout.
Watch what the new auction does.
Scenario 1: Price Repairs the Poor High and Accepts Above
ES returns to an old poor high, trades through it and begins building time and volume above the previous extreme. Footprint buying produces continued price progress and pullbacks remain above the old high.
The market is exploring beyond the unfinished auction and developing acceptance. The old poor high has not acted as meaningful resistance.
Scenario 2: Price Tests Above and Is Rejected
ES trades slightly through the old poor high but aggressive buying fails. The footprint shows absorption or exhaustion and price rapidly returns beneath the extreme.
The auction has now gathered more information beyond the previous boundary and rejected it.
Scenario 3: Price Stops Before the Level
The market can reverse before touching the old poor extreme. That is another reason traders should never assume Futures Poor Highs and Poor Lows must be revisited.
Repair, Breakout or Rejection?
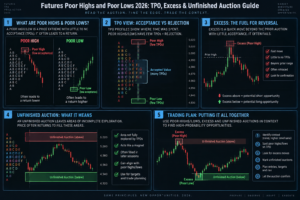
The word “repair” is often used when price revisits Futures Poor Highs and Poor Lows and develops additional auction structure around or beyond the old extreme.
Rather than treating repair as one fixed pattern, classify the result:
| Resolution | Observed Behavior | Interpretation |
|---|---|---|
| Acceptance Beyond | Time, volume and value develop outside old extreme | Auction continues price discovery |
| Probe + Rejection | Brief exploration followed by rapid return | New evidence of excess/rejection |
| Two-Way Repair | Market spends meaningful time around old extreme | Boundary becomes part of a broader accepted auction |
These outcomes fit directly into Futures Auction Market Theory 2026: the key question is whether new prices are accepted or rejected.
Order Flow Confirmation for Futures Poor Highs and Poor Lows
TPO explains the historical structure. Order flow can show how participants behave when Futures Poor Highs and Poor Lows are tested again.
Footprint Charts
A footprint can reveal aggressive buying through a poor high or aggressive selling through a poor low. Strong aggression plus successful continuation supports acceptance. Strong aggression with no progress can indicate absorption.
Volume Delta
Positive delta above a poor high is not automatically bullish. If price advances and holds, buyers are effective. If positive delta becomes extreme while price fails, recent buyers may be vulnerable.
See Futures Volume Delta 2026.
Cumulative Delta
CVD can show whether broader aggressive pressure supports the attempt to extend beyond the profile extreme. Divergence is supporting evidence, not a guaranteed reversal trigger.
Time & Sales
Tape activity can confirm whether meaningful transactions actually occur around the level instead of relying solely on displayed liquidity.
DOM and Level 2
Depth can show resting orders around the extreme, but displayed orders can change or disappear. Use Futures Level 2 Data 2026 for the distinction between MBP, MBO and executed flow.
Explore NinjaTrader for futures footprint, order-flow and market-depth analysis
TradeboticsAI Futures Poor Highs and Poor Lows Framework
TradeboticsAI evaluates Futures Poor Highs and Poor Lows using six layers instead of treating every flat TPO extreme as an automatic trade.
| Layer | Question | Higher-Quality Evidence |
|---|---|---|
| 1. Structure | Is the extreme genuinely poor? | Multiple TPO blocks with weak taper at profile extreme |
| 2. Prior Auction | What happened before the extreme formed? | Clear directional auction into the level |
| 3. Location | Where is the poor extreme relative to larger structure? | Weekly high/low, prior balance boundary or important composite area |
| 4. Retest Quality | How does price approach it? | Clear auction with measurable participation |
| 5. Order Flow | Does aggression succeed or fail? | Footprint/delta consistent with acceptance or rejection |
| 6. Resolution | What does the auction finally prove? | Clear acceptance beyond or rejection back inside |
The framework prevents the biggest analytical error: believing Futures Poor Highs and Poor Lows contain a built-in prediction. The profile identifies incomplete-looking structure. The future auction determines whether that structure matters.
Practical Futures Poor Highs and Poor Lows Example: ES
Assume ES finishes Monday with a session high at 6,525.00. The top two TPO rows are relatively flat and contain multiple time brackets. There is no clear taper or rejection tail at the extreme.
TradeboticsAI marks 6,525.00 as a poor high reference—not as an automatic short level.
On Wednesday, ES rallies from 6,505.00 toward the old poor high.
Outcome A: Auction Completes Through Acceptance
ES trades 6,525.25, 6,526.00 and then 6,528.00. Footprint data shows aggressive buying, price continues making progress and the developing profile begins accumulating activity above Monday’s high.
In this scenario, Futures Poor Highs and Poor Lows analysis helped identify a meaningful area, but the correct interpretation is continuation—not a fade.
Outcome B: Exploration and Rejection
ES trades to 6,525.75. Ask-side volume expands and bar delta turns strongly positive, but price cannot extend. Sellers absorb repeated buying, ES falls below 6,525.00 and the retest from underneath fails.
Now the market has explored beyond the old poor extreme and rejected those higher prices. The new auction provides stronger evidence than Monday’s profile alone.
Outcome C: No Test
ES reaches 6,522.00 and reverses sharply. The poor high remains untouched. Nothing in TPO theory requires the market to complete the level immediately.
This three-scenario model is more robust than the claim that every poor high or poor low must be filled.
Practical Futures Poor Highs and Poor Lows Trading Workflow
- Use a consistent session template. RTH and ETH profiles can produce different highs, lows and TPO structures.
- Standardize TPO block size. Thirty-minute blocks are common, but your methodology must remain consistent.
- Standardize ticks per row. Row aggregation can change whether an extreme appears flat or tapered.
- Identify the completed profile. Do not classify a developing extreme prematurely.
- Confirm multiple TPOs at the extreme. Verify that the structure actually meets your poor-high/poor-low definition.
- Compare with excess. Determine whether meaningful tapering or rejection exists.
- Mark the level as a reference—not a guaranteed target.
- Wait for a future approach. Do not open a trade merely because the old structure exists.
- Read order flow at the retest. Footprint, delta, tape and market depth can help identify acceptance or failure.
- Define invalidation. Let actual auction structure—not a belief about unfinished business—determine when the thesis is wrong.
This process makes Futures Poor Highs and Poor Lows part of a broader auction framework instead of a standalone predictive pattern.
Common Futures Poor Highs and Poor Lows Mistakes
1. Defining a Single-TPO Tail as a Poor Extreme
Current TPO documentation from TradingView defines poor highs and lows as extreme levels containing more than one TPO block. A tapered one-block extreme represents different auction information.
2. Assuming Price Must Return
Futures Poor Highs and Poor Lows can attract future attention, but no rule guarantees when—or whether—a revisit will occur.
3. Automatically Fading the Level
An unfinished high can be repaired by a successful breakout. Shorting simply because the market reached an old poor high can put the trader against genuine price discovery.
4. Ignoring the TPO Configuration
Changing row size or block duration can change the profile shape. Maintain consistent settings when collecting data.
5. Mixing RTH and ETH Profiles
An RTH poor high and an overnight-profile extreme represent different session structures. Label them clearly.
6. Ignoring Volume and Order Flow
TPO measures time at price. A future retest becomes easier to interpret when transaction volume and aggressive flow are also considered.
7. Treating “Unfinished” as “Weak Resistance”
A poor high is not automatically resistance at all. It is an extreme lacking clear rejection.
8. Using Unsupported Win Rates
Do not assume a universal 70%, 80% or 90% probability because an article assigns one. Results depend on contract, session, profile settings, entry definition, risk model and sample period.
Pros and Limitations of Futures Poor Highs and Poor Lows
Pros
- Provides an objective TPO structure at session extremes.
- Highlights areas lacking decisive auction rejection.
- Works naturally with Auction Market Theory.
- Can create useful future reference levels.
- Combines well with footprint and delta confirmation.
- Encourages traders to separate acceptance from rejection.
Limitations
- No revisit is guaranteed.
- Profile settings can change the classification.
- The level alone does not provide entry direction.
- Terminology is inconsistently used across trading education.
- Old structures can lose relevance as market conditions change.
- Order-flow confirmation still produces false signals.
Best For
Futures Poor Highs and Poor Lows are most useful for intraday and auction-market traders already using TPO, Market Profile or order-flow tools and looking for structured references at previous session extremes.
Not Ideal For
They are not ideal for traders searching for automatic support/resistance signals or anyone expecting every unfinished auction to be repaired on a predictable schedule.
Futures Poor Highs and Poor Lows FAQ
What are Futures Poor Highs and Poor Lows?
Futures Poor Highs and Poor Lows are TPO profile extremes containing multiple blocks and lacking the taper commonly associated with decisive rejection.
What does a poor high mean?
A poor high indicates that an upward auction stopped at an extreme without displaying clear excess. It can be monitored for possible future exploration above the high.
What does a poor low mean?
A poor low is the downside equivalent: the session stops extending lower without forming a clearly tapered rejection extreme.
How many TPOs create a poor high or low?
TradingView’s current TPO documentation defines poor highs and lows as extreme levels containing more than one TPO block. Platform algorithms can vary, so document the exact definition used by your software.
Is a single TPO at the high a poor high?
Not under the definition used here. A poor extreme is characterized by multiple TPO blocks and a lack of clear tapering.
Are Futures Poor Highs and Poor Lows unfinished auctions?
They are commonly described that way because the profile extreme lacks decisive rejection. “Unfinished” should not be interpreted as a guarantee that price must return within a specific period.
Do poor highs always get revisited?
No. They can remain untouched for an extended period or never become relevant within a trader’s horizon.
Should you short a poor high?
Not automatically. A poor high can be broken and accepted above. Wait for the future auction to show rejection before treating it as a bearish setup.
Should you buy a poor low?
Not automatically. Price can continue lower and build value beneath the old poor low. The level is a reference, not a guaranteed floor.
What is the difference between a poor high and excess?
A poor high lacks clear tapering and rejection at the profile extreme. Excess shows stronger evidence that the auction tested an extreme and moved away decisively.
Are poor highs the same as single prints?
No. In TradingView’s TPO methodology, single prints are non-extreme levels containing one TPO block, while poor highs and lows are profile extremes containing multiple TPOs.
Can Volume Delta confirm a poor-high retest?
Delta can show whether aggressive buying is effective. Strong positive delta that produces acceptance above the high supports continuation; strong buying that fails to move price can support an absorption or trapped-buyer hypothesis.
What tools work well with poor highs and poor lows?
TPO Market Profile provides the original structure. Volume Profile, footprint charts, Volume Delta, Cumulative Delta, Time & Sales and Auction Market Theory can add confirmation.
Final Verdict: How to Use Futures Poor Highs and Poor Lows Correctly
Futures Poor Highs and Poor Lows are useful because they identify session extremes where the TPO profile stopped without displaying convincing auction rejection.
The structure itself is simple: multiple TPO blocks remain at the extreme and the profile lacks the taper associated with stronger excess.
The interpretation requires more discipline.
A poor high is not automatically resistance. A poor low is not automatically support. Neither level is guaranteed to be revisited, repaired or broken within a specific period.
The stronger TradeboticsAI process is:
identify poor structure → mark the reference → wait → observe the retest → measure order flow → classify acceptance or rejection → manage risk.
Use Futures Poor Highs and Poor Lows alongside Futures Market Profile, Auction Market Theory, Volume Profile, Footprint Charts, Volume Delta and Futures Order Flow Trading.
The objective is not to predict that an unfinished auction must be completed. It is to recognize where the previous auction ended without clear rejection and be prepared to interpret what the market proves when that area becomes relevant again.
Explore NinjaTrader for futures order flow, market depth and simulation tools
Affiliate Disclosure: TradeboticsAI may receive compensation when eligible users complete a qualifying action through certain affiliate links. Affiliate relationships do not determine our editorial conclusions.
Risk Disclosure: Futures trading involves substantial risk of loss and is not suitable for every investor. Market Profile, TPO structures, poor highs, poor lows, Volume Profile, footprint charts, delta and historical auction behavior do not predict future returns. An unfinished-looking auction is not guaranteed to be revisited, and simulated results do not guarantee future live performance. Nothing on this page is personalized investment, financial, tax or trading advice.