Futures Level 2 Data 2026: MBO, MBP, DOM & Market Depth Guide
Futures Level 2 Data reveals more than the best bid and ask. It shows resting liquidity across multiple prices and, depending on the exchange feed and platform, can expose aggregated quantity, numbers of orders, individual order sizes, queue information and full depth of book. For active futures traders, this data sits underneath tools such as the DOM, order-book imbalance indicators and iceberg analytics. The critical distinction is that not every Level 2 feed contains the same information: Market by Price (MBP) and Market by Order (MBO) provide materially different views of the central limit order book.
Quick Answer
Futures Level 2 Data displays market depth beyond the top bid and offer. CME Market by Price aggregates orders at each price and provides up to a defined number of price levels, while Market by Order can provide individual order sizes, queue position and full order-level depth. A DOM is the interface used to visualize this information; it is not itself the underlying market-data format. Traders should distinguish Level 1, MBP, MBO and executed-trade data before relying on depth, queue or hidden-liquidity analysis.
Explore NinjaTrader for Level II market depth, SuperDOM and futures simulation
Affiliate Disclosure: TradeboticsAI may earn compensation when an eligible user completes a qualifying action through an affiliate link, at no additional cost to the user. Affiliate relationships do not determine our editorial conclusions.

What Is Futures Level 2 Data?
Futures Level 2 Data is market-depth information describing resting buy and sell orders beyond the inside market. It allows traders to examine available quantities across multiple price levels instead of seeing only the current best bid, best ask and last traded price.
NinjaTrader describes Level II data as current bid and ask prices together with available contract sizes. Its dedicated Level II window can display quotes, total size at each price and separate bid/ask depth information.
At the exchange-data level, however, the phrase “Level 2” can hide important differences. CME Group provides both Market by Price and Market by Order information. MBP aggregates liquidity at price levels. MBO exposes the individual orders that make up those price levels while keeping market participants anonymous.
This makes Futures Level 2 Data a broader concept than a DOM screen. The DOM is one possible visualization of the information. The underlying feed determines how granular the information can actually be.
Official references:
CME Group Market by Order FAQ
and
NinjaTrader Level II Window.
Futures Level 2 Data vs Level 1 Data
The easiest way to understand Futures Level 2 Data is to compare it with top-of-book information.
| Data | Typical Information | Best Question | Main Limitation |
|---|---|---|---|
| Level 1 / Top of Book | Best bid, best ask, last price, basic size | What is the current inside market? | No deeper liquidity view |
| Level 2 / Market Depth | Multiple bid and ask levels | Where is visible liquidity resting? | Granularity depends on feed |
| MBO | Individual anonymous orders and queue detail | What orders make up each price level? | Requires compatible feed/software |
A trader who only wants a chart and current quote may not need advanced market depth. An execution-focused scalper, order-flow trader or quantitative researcher can obtain significantly more information from Futures Level 2 Data.

Market by Price: Aggregated Futures Level 2 Data
Market by Price is the traditional aggregated representation of Futures Level 2 Data. Instead of showing every resting order individually, orders at the same price are combined into a total quantity.
For example, suppose three buy orders are resting at 6,500.00:
- Trader/order A: 10 contracts
- Trader/order B: 25 contracts
- Trader/order C: 40 contracts
An aggregated MBP display can show approximately 75 contracts bid at 6,500.00 rather than exposing those orders separately.
CME Group states that its MBP format consolidates quantity into a single update for each price level and includes total quantity and number of orders. CME also explains that MBP restricts updates to a maximum of ten price levels.
That is sufficient for many forms of Futures Level 2 Data analysis, including basic DOM depth, bid/ask imbalance and evaluating whether liquidity appears concentrated above or below the market.
Its limitation is equally important: aggregated data does not allow individual queue position or order sizes to be determined with high accuracy.
Market by Order: Order-Level Futures Level 2 Data
Market by Order provides a more granular version of Futures Level 2 Data. CME describes MBO as an order-based data feed that supports visibility into individual queue position, full depth of book and the size of individual orders at each price level while participant identity remains anonymous.
Using the same example, MBO can represent the separate 10-, 25- and 40-contract orders rather than only the aggregated 75-contract total.
This additional granularity matters for several advanced use cases:
- estimating queue position;
- studying order additions and cancellations;
- distinguishing one large order from many smaller orders;
- native iceberg analysis;
- liquidity-replenishment research;
- high-resolution order-book reconstruction;
- execution-model development.
CME Group now describes its futures and options data offering as ranging from top-of-book information through granular order-by-order depth, with full-depth information available for more advanced quantitative and execution use cases.
For manual retail trading, not every platform exposes every MBO field. Access to an exchange feed does not automatically mean the interface displays the complete underlying dataset.
Futures Level 2 Data: MBO vs MBP Comparison
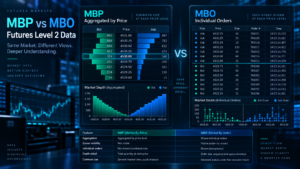
| Feature | Market by Price | Market by Order |
|---|---|---|
| Book Structure | Aggregated by price | Individual orders |
| Individual Order Size | Not reliably visible | Available |
| Queue Position | Limited estimate | Greater order-level transparency |
| Book Depth | Limited price-level representation | Full depth where supported |
| Iceberg Analysis | Mostly inferred from replenishment | Native refresh analysis can be stronger |
| Bandwidth / Complexity | Lower | Greater data volume and processing complexity |
| Typical Retail Need | DOM and general depth analysis | Advanced execution and microstructure analysis |
CME stated when MBO was introduced that the additional information could materially increase feed bandwidth. This illustrates the trade-off: higher-resolution Futures Level 2 Data can improve transparency but requires greater processing capacity.
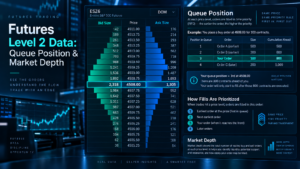
Queue Position in Futures Level 2 Data
Queue position matters because several limit orders can rest at the same price. When an aggressive order arrives, the exchange matching algorithm determines which resting orders receive fills first.
Consider a simplified ES bid at 6,500.00 containing:
| Queue Sequence | Order Size | Cumulative Quantity Ahead |
|---|---|---|
| Order A | 20 | 0 |
| Order B | 35 | 20 |
| Your Order | 5 | 55 |
If 30 contracts execute at the bid, the market has traded at your limit price without necessarily reaching your five-contract order. Quantity ahead of you can receive the available fills first under the relevant matching methodology.
Aggregated MBP can tell you that substantial quantity exists at the level, but it cannot provide the same individual-order queue detail as MBO.
This is one of the clearest practical benefits of advanced Futures Level 2 Data: price touching a limit order does not guarantee execution, and queue information helps explain why.
Futures Level 2 Data vs DOM: What Is the Difference?
Futures Level 2 Data and DOM are often used interchangeably, but technically they describe different things.
Level 2 data is the market-depth information.
DOM—Depth of Market—is an interface that organizes that information vertically around tradable prices.
The same underlying data can potentially be displayed as:
- a SuperDOM;
- a Level II window;
- a heatmap;
- an order-book table;
- a custom algorithmic feed;
- an imbalance indicator.
NinjaTrader’s Level II window separates bid and ask market-depth information while its SuperDOM combines depth visualization with order-entry functionality.
This distinction is important when comparing platforms. Two applications can both advertise a DOM while exposing different amounts of underlying Futures Level 2 Data.
For ladder execution rather than the underlying data architecture, see our Futures DOM Trading 2026 guide.
Futures Level 2 Data vs Time & Sales
The order book and the tape answer different questions.
| Data Source | Shows | Key Question |
|---|---|---|
| Level 2 / DOM | Resting orders | Where is liquidity currently displayed? |
| Time & Sales | Completed trades | What actually executed? |
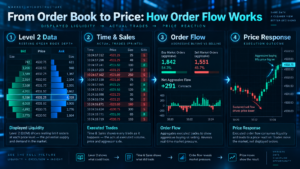
A 500-contract bid in Futures Level 2 Data can disappear before trading. Time & Sales can confirm whether sellers actually executed into that bid.
Conversely, a level showing only 50 contracts can ultimately execute hundreds if liquidity repeatedly replenishes.
This is why professional-style order-flow analysis does not treat displayed depth as proof of future execution. The strongest observations compare resting liquidity with actual trades and the resulting price response.
See Futures Time and Sales 2026 for the executed-trade side of the process.
Futures Level 2 Data and Iceberg Orders
Hidden liquidity is one of the most important limitations of ordinary Futures Level 2 Data. An iceberg order displays only part of its total quantity, meaning the visible order book can understate the passive liquidity available at a price.
Suppose an offer displays 20 contracts. Aggressive buyers execute those 20, but another 20 appear. This repeats several times while price cannot move higher.
On aggregated MBP data, the trader can observe replenishment but may not know whether one native iceberg, a synthetic execution algorithm or multiple independent participants are responsible.
CME MBO provides stronger native-iceberg evidence because exchange-assigned order IDs remain associated with CME-held iceberg refresh behavior. This can help compatible analytics distinguish native replenishment from visually similar patterns.
For the complete hidden-liquidity framework, use our Futures Iceberg Orders 2026 guide.
Practical Futures Level 2 Data Example: ES
Consider a hypothetical ES market:
| Price | Bid Size | Ask Size |
|---|---|---|
| 6,501.00 | — | 420 |
| 6,500.75 | — | 240 |
| 6,500.50 | — | 180 |
| 6,500.25 | — | 110 |
| 6,500.00 | 350 | — |
| 6,499.75 | 510 | — |
The book appears bid-heavy near the inside market. But three different scenarios are possible.
Scenario 1: Bid Depth Persists
Sellers execute into 6,500.00, but the 350-contract bid remains or replenishes. Price does not move lower. Futures Level 2 Data and actual executions together support an absorption hypothesis.
Scenario 2: Bid Depth Is Pulled
As sellers approach, most of the 350 contracts disappear before execution. ES immediately trades through 6,500.00. The earlier depth was real when displayed, but it was not persistent.
Scenario 3: Bid Depth Is Consumed
Sellers execute hundreds of contracts into the bid and continue selling until the liquidity is exhausted. Price falls despite the initially large displayed bid.
The lesson is that Futures Level 2 Data describes available liquidity now. Execution behavior determines what that liquidity ultimately means.
For quantitative bid/ask asymmetry, see Futures Order Book Imbalance 2026.
TradeboticsAI Futures Level 2 Data Analysis Framework
TradeboticsAI uses five layers to evaluate Futures Level 2 Data. This is an editorial framework designed to prevent traders from interpreting one large DOM number as a complete signal.
| Layer | Question | Useful Evidence |
|---|---|---|
| 1. Data Resolution | What data am I actually receiving? | Top of book, MBP, MBO, depth levels |
| 2. Location | Why does this price matter? | Prior high/low, VWAP, VAH/VAL, breakout area |
| 3. Persistence | Does the displayed liquidity remain? | Repeated updates, replenishment, limited pulling |
| 4. Execution | What actually trades? | Tape, footprint, fill activity |
| 5. Price Response | Does liquidity affect the auction? | Acceptance, rejection, breakout or consumption |
The framework makes an important distinction: Futures Level 2 Data is an observation layer. It becomes potentially useful for trading only when the trader understands the data resolution and connects displayed liquidity with real executions.
Explore NinjaTrader for Level II, SuperDOM and simulated order-flow analysis
Data Feed Quality Matters for Futures Level 2 Data
One of the largest sources of confusion in Futures Level 2 Data analysis is assuming that every broker, charting platform and feed provides the same order-book information.
Before comparing two platforms, verify:
- real-time vs delayed market data;
- top-of-book vs market-depth subscription;
- number of depth levels supplied;
- Market by Price vs Market by Order availability;
- whether the platform exposes individual orders;
- queue-position functionality;
- implied order handling;
- historical depth availability;
- update throttling or aggregation;
- the active futures expiration.
CME’s current futures and options market-data catalog states that available resolution ranges from top-of-book data for execution use cases to granular full depth-of-book data for more advanced quantitative modeling.
A platform interface can also simplify or transform the raw feed. Therefore, a feature labeled “Level II” does not automatically prove that the user is seeing full MBO detail.
For execution-quality implications of depth and spread, see Futures Market Liquidity 2026.
Common Futures Level 2 Data Mistakes
1. Assuming Every Level 2 Feed Is the Same
Aggregated MBP and order-level MBO contain different information. Verify the feed before interpreting queue or individual orders.
2. Treating Displayed Liquidity as Guaranteed
Resting orders can be modified or canceled before they trade. Futures Level 2 Data represents the current book, not a promise that liquidity will remain.
3. Confusing the DOM With the Data Feed
A DOM is a visualization and order-entry interface. The underlying market-data subscription determines what information can be displayed.
4. Ignoring Executed Trades
A large bid matters differently if sellers actually trade into it and price holds versus if it disappears before execution.
5. Assuming Price Touch Equals Fill
Queue position can prevent a resting limit order from filling even when transactions occur at the same price.
6. Ignoring Hidden Liquidity
The public displayed book can understate available passive liquidity because iceberg orders expose only part of their total size.
7. Using the Wrong Futures Contract
During rollover, the expiring contract can lose meaningful depth rapidly. Always confirm where liquidity has migrated.
8. Overreacting to One Book Update
Depth changes continuously. Persistent behavior generally contains more useful information than a single momentary snapshot.
Pros and Limitations of Futures Level 2 Data
Pros
- Shows liquidity beyond the best bid and ask.
- Helps evaluate short-term execution conditions.
- MBO can provide individual order and queue detail.
- Supports DOM, iceberg and order-book imbalance analysis.
- Useful for scalping and quantitative microstructure research.
- Can explain why limit orders do or do not receive fills.
Limitations
- Displayed liquidity can disappear before execution.
- Feed granularity differs between providers.
- Hidden quantity is not fully visible in ordinary depth.
- MBO produces substantially more data to process.
- Level 2 alone does not show completed trades.
- Fast-changing depth can encourage overinterpretation.
Who Should Use Futures Level 2 Data?
Futures Level 2 Data is most useful for active intraday traders, scalpers, execution-focused traders and quantitative researchers who need information beyond ordinary chart candles.
A trader primarily holding positions for days or weeks may gain relatively little from watching every order-book update. For a scalper trying to understand spread, depth, queue position, replenishment and immediate execution, the data can be much more relevant.
Beginners should first understand futures contract specifications, tick values, order types and liquidity before trying to derive signals from market depth.
Use our Futures Contract Specifications 2026 guide for the underlying contract mechanics.
Futures Level 2 Data FAQ
What is Futures Level 2 Data?
Futures Level 2 Data shows market depth beyond the current best bid and ask. Depending on the feed, it can include multiple price levels, aggregate quantities, numbers of orders, individual order sizes and queue information.
What is the difference between Level 1 and Level 2?
Level 1 primarily provides top-of-book information such as best bid and ask. Level 2 adds deeper resting liquidity across multiple price levels.
What is Market by Price?
Market by Price aggregates resting orders into total quantities at each price level rather than displaying every order individually.
What is Market by Order?
MBO provides order-level market data. CME states that it can provide individual order size, queue position and full depth while participants remain anonymous.
Does MBO show trader identities?
No. CME describes MBO as providing detailed order information while orders remain anonymous.
Is Level 2 the same as DOM?
No. Futures Level 2 Data is the market-depth information. A DOM is one interface used to visualize and trade from that information.
Is Level 2 the same as Time & Sales?
No. Level 2 primarily represents resting liquidity. Time & Sales records transactions that have actually executed.
Can Level 2 data show queue position?
It depends on the feed. MBO provides much greater individual-order and queue transparency than aggregated MBP data.
Can Level 2 data detect iceberg orders?
Replenishment can be inferred from ordinary depth, but MBO can provide stronger evidence for native CME iceberg refresh behavior. The full hidden remainder is not simply displayed in the public book.
Can Futures Level 2 Data predict price?
No. Futures Level 2 Data shows current resting liquidity and book structure. Orders can be canceled, hidden liquidity can exist and aggressive trades can overwhelm displayed depth.
Why does my DOM differ from another trader’s?
The two setups may use different feeds, depth subscriptions, aggregation, MBO/MBP data, platform settings, contract months or delayed versus real-time data.
Does NinjaTrader support Level II data?
Yes. NinjaTrader documents a dedicated Level II window and also displays market depth through SuperDOM. The exact information available depends on the connected market-data service and subscription.
Final Verdict: How to Use Futures Level 2 Data Correctly
Futures Level 2 Data is valuable because it exposes the liquidity structure hidden behind a simple best bid and ask. But its usefulness depends on knowing exactly what data is being displayed.
Market by Price provides an aggregated view of quantity at each price. Market by Order provides deeper order-level information, including individual sizes and queue transparency where supported. A DOM then turns that information into a visual ladder that can also be used for order execution.
The biggest mistake is treating displayed liquidity as guaranteed future support or resistance. Orders can disappear, hidden liquidity can emerge and aggressive trading can consume even a deep book.
TradeboticsAI therefore evaluates Futures Level 2 Data through five layers: data resolution → market location → liquidity persistence → executed flow → price response.
Combine this data with Futures DOM Trading, Order Book Imbalance, Iceberg Orders, Time & Sales and Market Liquidity to build a complete order-flow framework rather than relying on one flashing number in the book.
Explore NinjaTrader for futures Level II, SuperDOM and simulated order execution
Affiliate Disclosure: TradeboticsAI may receive compensation when eligible users complete a qualifying action through certain affiliate links. Affiliate relationships do not determine our editorial conclusions.
Risk Disclosure: Futures trading involves substantial risk of loss and is not suitable for every investor. Level 2 data, DOM depth, queue information, MBO, MBP, iceberg analysis and order-book behavior do not predict future returns. Displayed orders can be modified or canceled rapidly, and simulated results do not guarantee future live performance. Nothing on this page is personalized investment, financial, tax or trading advice.