Spot Grid vs Futures Grid 2026: Leverage, Funding & Liquidation
Spot grid vs futures grid is not simply a choice between two versions of the same crypto bot. Both can place orders across a predefined price range, but the market underneath the bot changes the risk structure. A spot grid buys and sells the underlying assets. A futures grid trades derivative contracts supported by margin, which can add long, short or neutral modes, leverage, funding payments and liquidation risk. That difference affects capital exposure, costs, P&L interpretation and what can happen when price leaves the grid range.
Affiliate Disclosure: TradeboticsAI may earn compensation from qualifying actions completed through affiliate links. This does not change our analysis. Crypto and derivatives trading involve substantial risk. Leverage can magnify losses, and automated execution does not remove market risk.

Spot Grid vs Futures Grid at a Glance
The fastest way to evaluate spot grid vs futures grid is to separate the shared grid logic from the market-specific risks. Both strategies can divide a selected price band into multiple levels and attempt to capture repeated movement between those levels. The similarities largely stop there.
| Feature | Spot Grid | Futures Grid |
|---|---|---|
| Market | Spot market | Perpetual or futures contract, depending on platform |
| Underlying ownership | Holds base and quote assets | Holds a derivative position supported by margin |
| Leverage | Normally none in a standard spot grid | Often available |
| Liquidation | No futures-style liquidation in a standard non-leveraged spot grid | Possible if margin requirements are not maintained |
| Funding | No perpetual-futures funding payment | Funding may be paid or received on perpetual contracts |
| Directional modes | Primarily spot exposure | May support long, short and neutral modes |
| Main out-of-range risk | Inventory concentration and asset price loss | Directional exposure, margin pressure and possible liquidation |
| P&L focus | Grid profit plus change in value of held assets | Realized grid profit plus unrealized futures P&L, fees and funding |
Official documentation supports these structural differences. Bybit states that its Spot Grid Bot operates in the spot market without liquidation risk, while its Futures Grid Bot can be liquidated when maintenance-margin conditions are reached and can incur funding fees. Pionex likewise distinguishes spot ownership from futures margin, leverage, funding and liquidation. See the current Bybit Spot Grid FAQ, Bybit Futures Grid FAQ and Pionex Spot vs Futures Grid documentation.
1. Spot Grid vs Futures Grid: What Actually Changes Under the Bot?
In spot grid vs futures grid, the visible grid can look almost identical: lower bound, upper bound, number of grids and a sequence of buy and sell orders. The important distinction is what each order represents.
A standard spot grid exchanges one asset for another. In a BTC/USDT example, the bot may hold a mixture of BTC and USDT. When price falls through lower grid levels, more quote currency can be converted into BTC. When price rises through higher levels, BTC can be sold back into USDT. If price falls below the configured range, the bot may be left holding more BTC. That does not create futures-style liquidation, but the BTC can continue falling in market value.
A futures grid opens and closes derivative exposure instead. The bot is managing contracts and margin rather than simply exchanging the underlying assets. The futures account therefore has additional state variables: entry price, mark price, position size, maintenance margin, available margin, funding payments and an estimated liquidation price. These variables can remain relevant even when no new grid orders are being filled.
This is also why spot grid vs futures grid should not be compared only by the number of completed trades. Two bots can complete the same number of grid cycles while producing very different total account outcomes.
2. Leverage Changes Exposure, Not the Quality of the Grid
Leverage is the largest mechanical difference in many spot grid vs futures grid comparisons. With futures, a trader may control a position larger than the margin committed to the bot. For a simplified illustration, $1,000 of margin at 3x leverage can create roughly $3,000 of notional exposure before exchange-specific adjustments.
That does not make a weak grid setup stronger. If the range is poorly chosen, the grid spacing is too tight for costs, or the market trends hard against the selected direction, leverage magnifies the consequences of the same design problem.
| Example | Spot Grid | Futures Grid at 3x |
|---|---|---|
| Capital / margin | $1,000 | $1,000 |
| Simplified notional exposure | About $1,000 of assets | About $3,000 before exchange-specific adjustments |
| Adverse market move | -5% | -5% |
| Simplified mark-to-market effect before costs | About -$50 on equivalent fully exposed capital | About -$150 on $3,000 notional |
This example is intentionally simplified. Real grid exposure changes as orders fill, and futures liquidation depends on entry price, margin mode, maintenance-margin requirements, fees, mark price and the platform’s specific risk engine. It should not be used as a liquidation-price formula.
For spot grid vs futures grid, leverage should be treated as a risk multiplier before it is treated as a return multiplier. The useful conclusion for spot grid vs futures grid is that leverage increases sensitivity to market movement. It can also increase trading-fee dollars because fees are generally charged on traded notional rather than only on posted margin. Always test costs using the exchange’s actual fee schedule.
3. Liquidation Risk Is Different From a Range Break
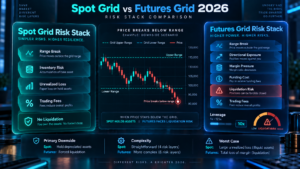
The most important risk distinction in spot grid vs futures grid is liquidation. Standard spot grid trading does not have the same forced-close mechanism as a margined futures position. Spot can still lose substantially if the underlying asset drops, but there is no futures maintenance-margin threshold that automatically closes a standard unleveraged spot position.
Futures are different. Bybit’s current Futures Grid FAQ states that its futures grid position can be liquidated when the bot’s maintenance margin rate reaches the platform’s liquidation threshold. Other exchanges use their own formulas and risk tiers. This is why an estimated liquidation price shown in the live platform is more useful than a generic formula copied from a blog.
Range Boundary vs Liquidation Boundary
In spot grid vs futures grid, a lower grid boundary is a strategy parameter. A liquidation price is a risk-engine output. They may be far apart, close together or move as the position and margin change.
| Event | Spot Grid | Futures Grid |
|---|---|---|
| Price exits below the grid | New grid trading may pause; bot can hold more base asset | New grid activity may pause while the futures position and margin risk remain |
| Price re-enters the range | Grid trading may resume if the bot remains active | May resume only if the futures position still exists and sufficient margin remains |
| Large adverse move | Can create a large unrealized asset loss | Can create a large unrealized derivative loss and potentially liquidation |
| Forced futures liquidation | Not applicable to standard non-leveraged spot grid | Possible under the exchange’s margin rules |
A stop loss can close either strategy before a larger loss, but a stop order is not guaranteed to fill at the exact trigger price during fast markets. That execution gap matters in any spot grid vs futures grid risk plan. Review our dedicated Crypto Grid Bot Stop Loss guide for exit-rule design.
4. Funding, Trading Fees and the Real Cost Difference
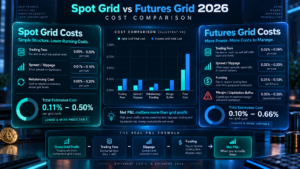
Costs can reverse an apparently attractive spot grid vs futures grid setup. Both strategies can incur trading fees and slippage. Futures grids can add funding payments when perpetual contracts are used.
In spot grid vs futures grid, funding exists only on the derivatives side when the selected perpetual contract uses a funding mechanism. Funding is periodically exchanged between long and short perpetual-futures participants. Depending on the contract, funding rate and position direction, a bot may pay or receive funding. A favorable rate can later become unfavorable, so funding should not be treated as fixed income.
Estimated trading-cost drag = Traded Notional × Fee Rate
Estimated funding cash flow = Position Notional × Funding Rate × Number of Funding Settlements
The sign of the funding cash flow depends on which side pays at each settlement. For conservative stress testing, model a scenario where the bot pays funding rather than assuming it will receive it.
For a detailed cost model that applies across bot types, use our Crypto Grid Bot Fees guide. The cost question in spot grid vs futures grid is not simply which has lower fees. It is which structure leaves more net P&L after all costs and position effects.
5. Grid Profit Is Not the Same as Total P&L
This is one of the most common sources of confusion in spot grid vs futures grid. A grid bot can complete profitable buy-sell cycles while the total strategy is losing money.
For spot grid vs futures grid, use the same measurement window and compare total equity rather than dashboard headline metrics. For spot, total economic outcome includes realized grid trades plus the changing value of the assets still held. If the bot repeatedly buys an asset during a decline, it can accumulate base inventory. Completed grid cycles may show gains while the remaining inventory has a larger unrealized loss.
For futures, the accounting can be even more layered. Realized grid profit can coexist with an open leveraged position that has negative unrealized P&L. Funding and fees can further change the result.
A Better P&L Checklist
- Realized grid profit after trading fees
- Unrealized P&L on currently held spot inventory or futures positions
- Funding paid or received for perpetual futures
- Slippage and spread during entry, rebalancing and termination
- Subscription or platform costs when applicable
- Conversion fees or market impact when the bot is closed
Our Crypto Grid Bot Profit Calculator is designed for fee-aware grid economics. Use it alongside the risk stress test below rather than treating projected grid APR as a forecast.
6. Futures Grid Can Add Long, Short and Neutral Modes
Directional flexibility is another important difference in spot grid vs futures grid. A standard spot grid is built around exchanging assets in the spot market. Futures grid platforms may offer long, short and neutral configurations.
| Futures Grid Mode | General Exposure | Primary Failure Risk |
|---|---|---|
| Long | Designed around bullish or upward-biased futures exposure inside a range | Sustained decline can produce losses and margin pressure |
| Short | Designed around bearish or downward-biased futures exposure inside a range | Sustained rally can produce losses and margin pressure |
| Neutral | Begins with a less directional grid structure around the current market | Filled orders can still create exposure; neutral does not mean zero liquidation risk |
A correct spot grid vs futures grid comparison therefore includes directional flexibility, not just leverage. Bybit documents Neutral, Long and Short as order-direction options for its Futures Grid Bot. Exact initialization rules differ by exchange, so do not assume neutral has the same mechanics everywhere.
This is where spot grid vs futures grid becomes a strategy-design decision rather than merely a software choice. If the intended thesis requires a short position, spot grid does not express that thesis in the same way. If the thesis is simply to automate buying and selling an asset already acceptable to hold, a derivatives position may add complexity that the strategy does not need.
7. Spot Grid vs Futures Grid Risk Stress Test
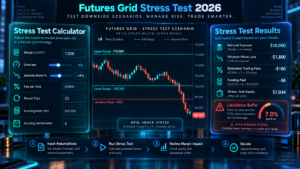
The calculator below adds original value to a spot grid vs futures grid comparison by focusing on downside mechanics rather than projected profit. It estimates how leverage, an adverse price move, trading fees and assumed funding payments could affect futures-grid margin. It is deliberately not a liquidation-price calculator because liquidation formulas vary by exchange, contract, margin mode and maintenance-margin tier.
Stress-test limitations: this model assumes constant notional exposure for simplicity. Real grid positions change as orders fill. It ignores maintenance margin, mark-price rules, liquidation fees, partial fills, tiered fees, changing funding rates and exchange-specific risk engines. Use the live platform’s estimated liquidation price and margin metrics before launching a futures grid.
Decision Framework: Which Structure Matches the Strategy?
A disciplined spot grid vs futures grid decision starts with the exposure you actually need. The best spot grid vs futures grid framework asks what market exposure is required before looking at projected returns.
| Question | If the Answer Is Yes | What It Suggests |
|---|---|---|
| Would you be comfortable holding the underlying asset if price falls below the range? | Yes | A spot grid structure may align more naturally with that exposure |
| Do you specifically need short exposure? | Yes | A futures-based structure may be required |
| Can the strategy tolerate funding and margin requirements? | No | A standard futures grid introduces risks the strategy cannot support |
| Have you defined a liquidation buffer and stop rule? | No | Do not treat futures leverage as a completed risk plan |
| Have costs been tested at realistic fee and funding assumptions? | No | Backtest or simulate before judging either structure |
For range design, use our Crypto Grid Bot Settings guide. For validation, use Crypto Grid Bot Backtesting. These pages cover configuration and testing; this spot grid vs futures grid page intentionally stays focused on the market-structure decision so the intents do not overlap.
A Practical Pre-Launch Sequence
- Define whether you need spot ownership or derivative exposure.
- Choose the market direction thesis.
- Set the price range independently from leverage.
- Check fee-adjusted grid spacing.
- For futures, inspect the exchange’s estimated liquidation price and margin metrics.
- Stress-test a move outside the intended range.
- Model funding as a cost, not as guaranteed income.
- Backtest and paper trade with realistic fees and slippage.
- Set stop conditions before capital is committed.
- Track total P&L instead of grid profit in isolation.

Common Spot Grid vs Futures Grid Comparison Mistakes
1. Assuming Spot Grid Cannot Lose Because It Cannot Be Liquidated
In spot grid vs futures grid, no futures-style liquidation does not mean no downside. A spot grid can accumulate an asset during a prolonged decline and suffer a substantial unrealized loss. The difference is the loss mechanism, not the existence of risk.
2. Treating 1x Futures as Identical to Spot
A 1x perpetual futures position is still a derivative contract. Funding, margin rules, mark-price calculations and settlement mechanics can remain different from spot ownership.
3. Comparing Grid Profit Without Total P&L
Positive completed-grid profit can coexist with a negative total result. This can happen in both structures, although futures adds more variables. Every spot grid vs futures grid test should record total equity at the same timestamps, not just completed grid cycles.
4. Choosing Leverage Before Choosing the Range
Leverage should not be used to compensate for a range with poor expected behavior. First test whether the range and spacing make sense without leverage.
5. Ignoring Funding During Longer Futures Runs
Funding may look small per settlement, but repeated payments can accumulate. Stress-test adverse funding assumptions over the intended holding period.
6. Believing Neutral Futures Grid Means Risk-Free
Neutral generally describes how the futures grid is initialized or how orders are arranged. Filled orders can create an open position. A neutral futures grid can therefore still face unrealized losses and liquidation risk.
Best Use Cases and Poor Fits
Use this spot grid vs futures grid section as a suitability filter, not as a promise of performance.
Spot grid may fit: users who want automated spot execution inside a range, accept holding the underlying asset and do not need short exposure or futures leverage.
Futures grid may fit: experienced derivatives users who specifically need long, short or neutral contract exposure and can monitor leverage, margin, funding and liquidation risk.
Poor fit for either: users expecting guaranteed passive income, anyone unwilling to monitor a broken range, or strategies that have not been tested with realistic costs.
Spot Grid vs Futures Grid FAQ
Is spot grid safer than futures grid?
In structural terms, a standard non-leveraged spot grid avoids futures liquidation and perpetual-funding mechanics. That removes important derivatives-specific risks, but spot can still lose substantially when the underlying asset declines. The correct spot grid vs futures grid comparison is therefore about different risk structures, not safe versus unsafe.
Can a spot grid bot be liquidated?
A standard spot grid that uses only owned assets does not face futures-style margin liquidation. If a product adds borrowing, margin or leverage, check the exact product rules.
Can a futures grid bot be liquidated even if price is still inside the grid range?
Potentially, yes. Liquidation depends on the futures position, margin and the exchange’s maintenance-margin rules. The grid range and liquidation price are different concepts.
Does futures grid always earn more because of leverage?
No. Leverage magnifies exposure; it does not guarantee higher net returns. Trading fees, funding, adverse position P&L and liquidation risk can offset or exceed realized grid profit.
Does a futures grid pay funding?
Perpetual-futures grids can be subject to funding. Depending on the rate and the bot’s position, funding may be paid or received. The rate can change while the strategy is running.
What is the biggest difference between spot grid and futures grid?
The underlying market. Spot grid trades actual assets. Futures grid trades derivative contracts supported by margin. That change introduces leverage, margin, funding, directional modes and liquidation mechanics.
Can grid profit be positive while total P&L is negative?
Yes. Completed grid cycles can generate realized gains while open inventory or futures positions carry larger unrealized losses.
Should leverage be included in grid backtesting?
Yes if the live strategy will use leverage. A relevant futures-grid test should model position exposure, fees, funding assumptions, stops and out-of-range behavior. See our Crypto Grid Bot Backtesting guide.
Final Verdict
The core lesson from spot grid vs futures grid is that similar grid logic can sit on top of very different financial structures. Spot grid exchanges the underlying assets and avoids futures-style liquidation, but it still carries inventory and price risk. Futures grid can add directional flexibility and capital-efficient exposure, but leverage, margin, funding and liquidation create additional failure modes.
Evaluate the required exposure first, then compare net economics under realistic costs. For either structure, define the range, calculate fee-adjusted spacing, test out-of-range behavior, predefine exits and track total P&L. For platform comparisons, see Best Crypto Grid Trading Bots 2026. For strategy alternatives, see Grid Bot vs DCA Bot.
Affiliate & Risk Disclosure: TradeboticsAI may earn compensation from qualifying affiliate actions. This content is educational and does not constitute financial, investment, tax or legal advice. Crypto assets and derivatives are volatile. Futures leverage can magnify losses and may result in liquidation. Historical, simulated or backtested performance does not guarantee future results.