Grid Bot vs DCA Bot: 7 Critical Differences, Costs & Risk
Grid bot vs DCA bot is a choice about how orders build, reduce and recycle a position. A spot grid trades between price levels. A price-triggered DCA trading bot adds planned entries and usually manages their combined exit. Both can lose money, including while a dashboard highlights profitable completed trades.
This grid bot vs DCA bot guide separates trading bots from scheduled dollar-cost averaging, calculates trading costs and compares three transparent $1,000 scenarios. The examples expose capital and exit assumptions; they are not historical backtests, platform performance claims or forecasts.
Quick Answer: Grid Bot vs DCA Bot
Study a spot grid when your tested rules depend on repeated movement between defined levels. Study a price-triggered DCA bot when you deliberately plan staged entries into one position and can fund the entire sequence. Use a separate recurring-purchase plan when your objective is buying a fixed dollar amount on a schedule.
Neither trading bot is automatically safer or more profitable. Compare total account equity, maximum capital committed, fees and the response to a failed market thesis.
Affiliate disclosure: TradeboticsAI may receive compensation if you complete a qualifying action through a labeled affiliate link. This commercial relationship is separate from the hypothetical calculations and does not establish a platform’s suitability or profitability.
Review the software after defining the strategy. Bitsgap documents both GRID and DCA bots; check your exchange, available settings and plan before subscribing.
Explore Bitsgap GRID & DCA Bots
Affiliate link. Exchange and product availability depend on your location and account.
Grid Bot vs DCA Bot: Define the Strategy First
A useful grid bot vs DCA bot comparison starts with the trigger for the next order. The label “DCA” is used for different products, and confusing them can leave a trader with much more exposure than intended.
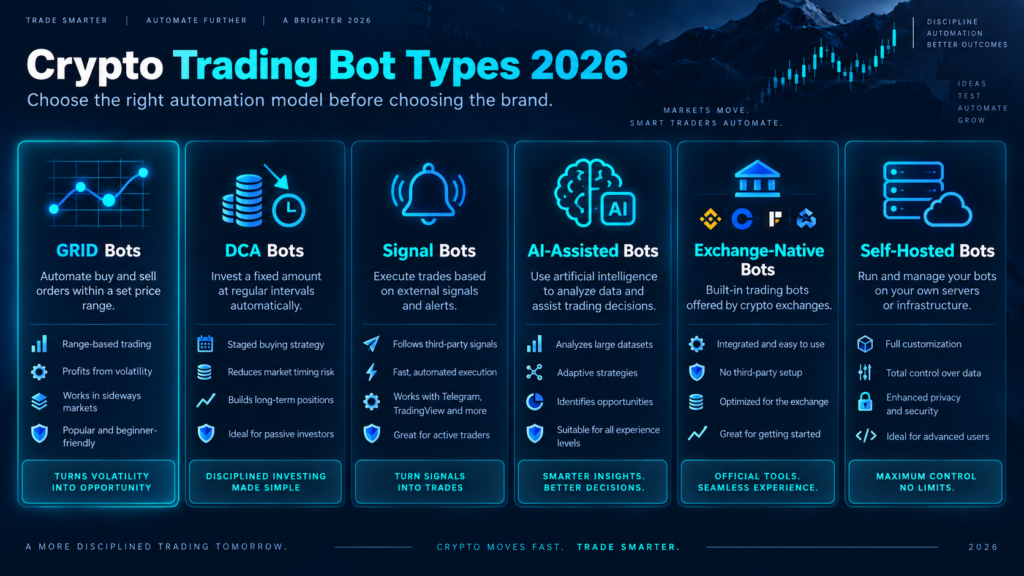
Spot grid: trade repeated price crossings
A conventional spot grid places orders across a price range. A filled buy can generate a sell above it; a filled sell can generate another buy below it. Some implementations purchase an initial inventory at launch. That inventory is exposed to price changes immediately.
Bitsgap’s GRID documentation describes predefined levels and replacement orders, while identifying strong directional moves as a risk. Repeated crossings matter: a fast decline is volatile, but it may complete very few profitable round trips.
DCA trading bot: accumulate a position under explicit rules
In this guide, a long DCA trading bot begins with an entry, adds purchases at specified lower prices and seeks an exit for the combined position. Providers may call the additions averaging orders or safety orders. The word “safety” does not mean that an order reduces the dollars you can lose.
Averaging orders can have equal or increasing sizes. Increasing them is a separate sizing choice, not a defining requirement of every DCA system. The Pionex comparison explicitly discusses its DCA/Martingale product, so its terminology should not be applied automatically to every provider.
Scheduled DCA: a different objective
Buying a fixed amount every Friday is time-based accumulation. It does not inherently include falling-price triggers, a take-profit target or position-size multipliers. In the grid bot vs DCA bot decision, identify whether you actually need an accumulation schedule or an active trading strategy.
Grid Bot vs DCA Bot: 7 Critical Differences
This grid bot vs DCA bot table describes conventional, unleveraged long strategies. Trailing grids, reverse grids, short strategies and derivatives can change the mechanics. Verify the actual order rules rather than assuming that a product name specifies them.
| Difference | Spot grid | Price-triggered DCA trading bot |
|---|---|---|
| 1. Entry trigger | Price reaches configured levels; initial inventory may be purchased. | An initial entry followed by specified averaging triggers. |
| 2. Exit unit | Individual lots can sell at different grid levels. | The accumulated position usually has a combined exit rule. |
| 3. Capital deployment | Inventory plus cash reserved for additional buys. | Initial order plus the entire planned averaging ladder and fees. |
| 4. Required price behavior | Enough two-way crossings to complete trades after costs. | A move to the combined exit after whatever entries have filled. |
| 5. Main stress case | Price leaves the range while inventory remains exposed. | The averaging ladder fills and the decline continues. |
| 6. Cost sensitivity | Small grid spacing can be consumed by two execution fees. | Fees apply to every entry and the larger eventual exit. |
| 7. Honest scorecard | Total equity, inventory, drawdown and all costs. | Total equity, committed capital, drawdown and time in the position. |
The grid bot vs DCA bot distinction does not identify a universal winner. A strategy can match its intended market behavior and still fail because of costs, poor fills or an incorrect assumption about future prices.
Grid Bot vs DCA Bot: Three Transparent $1,000 Scenarios
We calculated the following grid bot vs DCA bot examples from explicit order rules. Both start with a $1,000 cash allocation and a hypothetical asset priced at $100. Each execution pays a 0.10% fee in cash. Remaining inventory is sold at the final price, with another 0.10% fee.
These are synthetic arithmetic scenarios. They use ideal fills along continuous price paths, zero slippage and no subscription, tax, funding or borrowing costs. They are not tests of Bitsgap or any other product. No probabilities or time periods are assigned to the paths.
Show the exact rules used in the calculations
Grid: four independent two-unit slots use buy/sell pairs of $80/$90, $90/$100, $100/$110 and $110/$120. At launch, buy four units at $100 to seed the two upper slots, allocating two units to each. The two lower slots initially hold cash for their respective buys. Cash after initialization is $599.60.
When an active buy fills, its two units become available for sale at that slot’s upper price. When a sell fills, that slot waits to buy again at its lower price. Orders execute when the price path reaches their levels in the appropriate direction. No trailing, compounding, leverage or stop is used.
DCA: buy $200 of the asset at $100. Add $300 at $90 and $400 at $80 if those levels are reached. After each entry, set an exit for the entire position at 1% above its volume-weighted average purchase price, excluding fees. Stop after the first completed position; do not restart. Cash fees are paid in addition to those order amounts.
Holding benchmark: invest the same $1,000, including the entry fee, at $100. Buy approximately 9.99001 units, hold them through the path and sell at the final price with the same exit fee. Idle cash earns no interest in any strategy.
Every listed path is processed in order. These particular settings are chosen to make the accounting reproducible, not because they are recommended or optimized.
| Hypothetical price path | Grid | DCA | Buy and hold |
|---|---|---|---|
| Range: 100 → 90 → 100 → 90 → 100 | +$38.44 | +$4.00 | −$2.00 |
| Rally: 100 → 110 → 120 → 140 | +$59.14 | +$1.60 | +$397.20 |
| Decline: 100 → 90 → 80 → 60 | −$261.22 | −$281.52 | −$401.20 |
What the examples demonstrate
In the range example, the grid recycles the $90/$100 slot twice. Each two-unit round trip produces $20 before fees and $19.62 after them. Subtract the $0.40 initialization fee and $0.40 final inventory-sale fee to obtain $38.44.
The DCA bot closes its first combined position and remains in cash. Allowing automatic restarts would create a different experiment. In the rally, both trading rules reduce exposure early and miss much of the continued rise captured by holding.
In the decline, the grid ends with eight units and $259.26 cash. Selling those units at $60 yields $479.52 after the exit fee, leaving $738.78. The DCA position has approximately 10.33333 units and $99.10 cash; its final account value is $718.48.
Interpretation limit: equal starting budgets do not mean equal exposure. The grid initially buys $400, DCA buys $200 and the holding benchmark invests nearly all available cash. These outcomes explain mechanics; they do not show that one strategy has superior expected or risk-adjusted returns.
For a fair grid bot vs DCA bot performance study, also compare maximum and average exposure, time invested, drawdowns and behavior across unseen historical periods. Three selected paths cannot establish a trading edge.
Grid Bot vs DCA Bot Fees: Calculate the Break-Even Point
Fees can change a grid bot vs DCA bot decision before either bot trades. A small positive price difference does not necessarily cover two executions. Subscription costs create a separate hurdle even when individual trades are profitable.
An exact spot-grid round-trip formula
Assume the same asset quantity is bought and sold, with both fees paid in quote currency. Let B be the buy notional before fees, g the proportional price increase, and fb and fs the buy and sell fee rates expressed as decimals.
Net cycle P&L = B × [(1 + g) × (1 − fs) − (1 + fb)]
Fee-only break-even g = (1 + fb) ÷ (1 − fs) − 1
At 0.10% per side, the fee-only break-even step is approximately 0.2002002%. A 0.20% step is slightly below it because the sale fee is charged on a larger notional. This calculation excludes slippage and any software allocation.
| Price increase | Gross gain | Combined fees | Net cycle result |
|---|---|---|---|
| 0.10% | $0.1000 | $0.2001 | −$0.1001 |
| 0.20% | $0.2000 | $0.2002 | −$0.0002 |
| 0.40% | $0.4000 | $0.2004 | +$0.1996 |
| 1.00% | $1.0000 | $0.2010 | +$0.7990 |
Fees charged in the base asset or a discount token require adjustments. A limit order is not automatically a maker fill: an immediately marketable order can incur a taker fee. Use the actual execution report, including fee currency, rather than a generic advertised rate.
Subscription, spread and exit costs
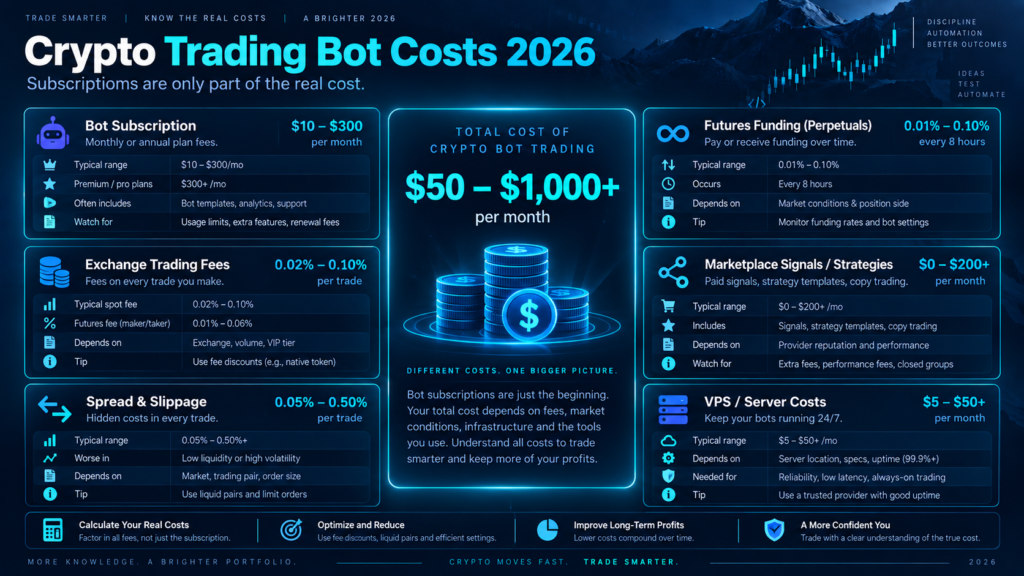
A hypothetical $20 monthly subscription equals 2% of a $1,000 allocation or 0.4% of a $5,000 allocation each month. Those are cost burdens, not return targets or a quoted Bitsgap plan. Annual billing may also commit cash before a strategy has been validated.
In a grid bot vs DCA bot cost audit, include any paid signals, hosting, forced conversions, minimum order sizes and final liquidation. If you calculate profit from actual fill prices, spread and slippage are already reflected in those prices; do not deduct the same execution loss twice.
Grid Bot vs DCA Bot Capital: Budget the Entire Ladder
The initial order is only one part of the grid bot vs DCA bot capital comparison. A DCA configuration can reserve modest cash or demand rapidly increasing amounts, depending on its averaging-order sizes.
| Entry | Buy notional | Units added | Cumulative notional |
|---|---|---|---|
| $100 | $200 | 2.00000 | $200 |
| $90 | $300 | 3.33333 | $500 |
| $80 | $400 | 5.00000 | $900 |
Total purchased quantity is approximately 10.33333 units. The average purchase price, excluding fees, is $900 ÷ 10.33333 ≈ $87.09677. The model’s gross 1% exit target is approximately $87.96774. At $60, the lower average entry does not prevent a substantial loss.
This is the key grid bot vs DCA bot capital lesson: lowering average entry and lowering financial risk are different outcomes. More units can increase the dollars lost during the next price decline.
How order-size multipliers change the budget
For initial order A, first averaging order B, multiplier m and N averaging orders, the planned buy notional is:
C = A + B × (m^N − 1) ÷ (m − 1) when m ≠ 1; with equal orders, C = A + N × B.
With a $100 initial order and four averaging orders beginning at $100, planned notional is $500 at a 1× multiplier, $912.50 at 1.5×, and $1,600 at 2×. Fees require additional funds. Specify whether a platform’s multiplier applies to quote amounts or asset quantities before using this formula.
For grids, minimum investment also depends on the number of levels, prices and exchange minimum order rules. A platform accepting a setup is not proof that its allocation or loss exposure is appropriate.
Check the complete settings before funding a bot. Compare initial inventory, averaging orders, exit behavior and the applicable subscription.
Review Bitsgap Bot Settings & Plans
Affiliate link. A software subscription does not establish a profitable trading strategy.
Grid Bot vs DCA Bot Results: Measure Total Equity
A dashboard can show completed grid gains while the unsold asset has lost more value. In the grid bot vs DCA bot comparison, use a consistent account-level measure, not whichever green number the interface emphasizes.
Net economic P&L = ending liquidation equity + withdrawals − deposits − starting equity − costs paid outside the account
Deposits and withdrawals here mean flows after the starting measurement. Ending liquidation equity includes cash and the net sale value of remaining assets. Costs already deducted from the account must not be subtracted again. Stablecoin balances also have their own valuation and issuer risks.
For example, $36 of completed gains after trading fees can coexist with a $145 inventory loss and $20 of separately paid software costs. The economic result is −$129. Realized gains do not cancel an open loss simply because the loss has not been closed.
Keep an export of orders, fills, fees and balance changes. Your grid bot vs DCA bot review should reconcile those records to account balances and explain any difference before judging performance.
Grid Bot vs DCA Bot: Best Uses, Pros and Cons
| Approach | Useful fit and advantages | Limitations and poor fits |
|---|---|---|
| Spot grid | Explicit range rules; repeated partial exits; visible order levels; potentially suitable for testing recurring price crossings. | Range failure, fee drag and inventory drawdowns. Poor fit for someone who cannot monitor exposure or wants uninterrupted participation in a rally. |
| Price-triggered DCA | Predefined staged entries; transparent capital ladder; a combined position and exit that can be modeled. | Exposure can grow during declines; capital can remain tied up; recovery may never occur. Poor fit when later orders depend on extra deposits. |
| Scheduled purchases | Simple recurring accumulation aligned with a time-based budget. | Continued asset-price risk and no inherent trading exit. Poor fit for someone seeking assured short-term income. |
For a beginner asking grid bot vs DCA bot, the first decision is whether the order and loss mechanics are understood. Fewer settings do not establish lower risk. A paper environment is useful for learning behavior without treating a successful demonstration as investment evidence.
Choose neither trading bot when exchange access is unclear, the full capital requirement is unaffordable, minimum orders make the setup impractical, or there is no written response to a persistent decline.
Grid Bot vs DCA Bot Risk: Spot, Futures and API Access
The grid bot vs DCA bot examples above use unleveraged spot positions. Futures introduce margin, liquidation and, for many perpetual contracts, funding payments. A spot simulation cannot validate a leveraged version of the same idea.
A spot grid’s lower boundary is not necessarily a stop-loss. Leaving the range can pause new trades while existing inventory continues losing value. Likewise, reaching the last DCA entry does not automatically close the position.
Write down what “stop” means in your platform: stop opening trades, cancel pending orders, sell inventory, close derivatives, or some combination. A stop-market order can slip; a stop-limit order may remain unfilled. Connectivity failures can interfere with software-managed exits.

API security is separate from strategy risk
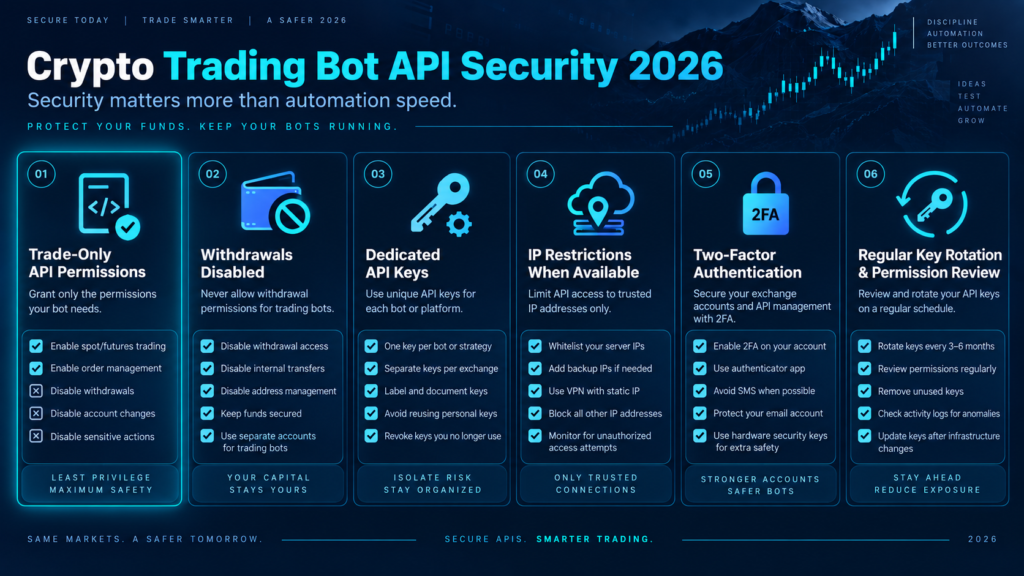
Use only the permissions a bot requires, disable withdrawals, protect both accounts with strong authentication and apply supported IP restrictions. For an unleveraged spot strategy, do not enable unnecessary derivatives or borrowing permissions.
A trading-only API key can still expose the account to harmful trades. Keeping funds at an exchange does not eliminate exchange custody, account-compromise or execution risks. Test how to revoke access and independently cancel orders or close exposure on the exchange.
How to Test Grid Bot vs DCA Bot Fairly
A credible grid bot vs DCA bot study must specify both the trading rules and the accounting before inspecting the results. Attractive parameters chosen after seeing a chart can hide overfitting.
- Freeze the specification. Record the exchange, pair, initial allocation, inventory, grid levels or averaging ladder, exit, stop, restart and compounding rules.
- Use consistent data and costs. Include relevant fees, minimum quantities and plausible adverse fills. One candle touching two levels does not prove their intrabar execution order.
- Reserve unseen data. Separate development from out-of-sample evaluation. Use walk-forward periods when adapting parameters, without revising earlier decisions using later prices.
- Stress the mechanism. Examine prolonged declines, breakouts, price gaps, missed fills, wider spreads, unavailable APIs and insufficient free balances.
- Use comparable scorecards. Report net equity, maximum drawdown, exposure, turnover, time underwater, fees and a suitable holding or cash benchmark.
- Check sensitivity. Change grid spacing, entry sizes, averaging depth and costs. A result that disappears after a small parameter change is fragile.
- Reconcile forward paper results. Verify actual order states and balances. Simulated success does not establish live execution quality or future profitability.
For tools, see our backtesting software comparison. The Cornix demo documentation also illustrates the distinction between built-in simulated accounts and external exchange testnets. Do not assume all testing environments use identical fill or fee models.
The strongest grid bot vs DCA bot conclusion may be that neither tested configuration clears its cost and risk requirements. That is a valid research result, even when a platform makes both easy to launch.
Platform Checks After the Grid Bot vs DCA Bot Decision
Bitsgap is one option to investigate because its official guides document both GRID setup and DCA setup. Their historical-testing features have plan-dependent limits. This guide does not rank the provider or claim that its execution matches our synthetic model.
Before paying, verify the specific exchange connection, trading pair, bot type, concurrent-bot limit, historical-data window, reporting export, cancellation terms and monthly versus annual billing. A provider listing an exchange does not establish that every product is available to every account.
For U.S. readers, check country and state eligibility with both the bot provider and the exchange. Do not treat global product pages as confirmation that a particular derivatives service or exchange entity is available to you.
Once you have settled the grid bot vs DCA bot requirements, compare implementation choices in our crypto grid bot platform comparison and broader crypto trading bot guide.

Grid Bot vs DCA Bot FAQ
Which is more profitable: a grid bot or a DCA bot?
Neither is universally more profitable. Results depend on price paths, exposure, entry and exit rules, fees and execution. Our synthetic grid bot vs DCA bot examples demonstrate those dependencies; they do not estimate expected returns.
Is a DCA trading bot the same as dollar-cost averaging?
Not necessarily. Scheduled dollar-cost averaging makes recurring purchases. A price-triggered DCA trading bot adds entries when configured conditions occur and typically manages an exit for the combined position. Confirm the provider’s definition.
Can a grid bot show profits while losing money overall?
Yes. Completed grid trades can be profitable while unsold inventory loses more value. Include open positions, all trading costs, external software charges and cash flows when evaluating the total result.
How much money does a DCA bot need?
It needs enough for the initial order, every planned averaging order and applicable fees. Minimum order requirements and sizing rules vary. Increasing order multipliers can make the complete budget much larger than the first order.
Does a grid stop-loss equal the bottom of its range?
No. A range boundary and a stop-loss can be separate settings. A bot may stop placing new orders outside the range while keeping its inventory. Verify whether stopping also closes positions and cancels pending orders.
Can I run grid and DCA bots together?
Some systems allow it, but both bots can share the same market exposure and available balance. Combined allocation, overlapping orders and correlation matter more than the number of bots. Separate labels do not create diversification.
Are the $1,000 examples actual trading results?
No. They are reproducible calculations on hypothetical price paths, using the exact rules disclosed above. They include stated execution fees but exclude slippage, subscriptions and other real-world costs. They are not historical or live performance.
Final Verdict: Grid Bot vs DCA Bot
The practical grid bot vs DCA bot decision comes down to the position you intend to hold, the sequence of trades you expect and the loss you can face when the market behaves differently.
A grid is a structure for repeated trades between levels. A DCA trading bot is a structure for staged entries and a combined exit. Scheduled purchases serve a separate accumulation objective. None provides a shortcut around fees, capital limits or a failing thesis.
Start with written rules, calculate the full capital path and evaluate total equity after costs. Compare software only after it is clear what the software must do.
Ready to compare the implementation? Inspect the available bot controls, exchange connections and current terms against your written requirements.
Check Bitsgap Features & Current Plans
Affiliate link. Check eligibility and full costs before subscribing or connecting an account.
Sources, Methodology and Disclosures
Sources were reviewed on September 19, 2026. Provider documentation supports descriptions of product mechanics; it does not independently prove performance. TradeboticsAI calculated the synthetic scenarios from the disclosed rules, checked the fill accounting and rounded final dollar results to cents.
Further primary references include Cornix’s arithmetic, geometric and custom grid settings and the CFTC advisory on automated-trading and AI return claims. The CFTC warns against promises of unusually high or guaranteed bot returns and highlights the impact of costs.
Arithmetic grids use fixed price differences; geometric grids use fixed ratios. Provider features, fees, supported exchanges and regional availability can change. Verify the applicable configuration in current documentation and your own account.
Affiliate disclosure: The three Bitsgap buttons are affiliate links. TradeboticsAI may receive compensation for qualifying referrals. Other linked provider documentation is included as an editorial reference. We do not claim firsthand live performance testing of the platforms in this article.
Risk disclosure: This content is educational and is not personalized investment, legal or tax advice. Cryptocurrency trading can result in loss of the entire amount committed. Leveraged products can introduce liquidation and losses beyond initial margin, depending on the product and applicable protections. Hypothetical examples and backtests do not predict future results. Automated orders, security controls and stop settings do not guarantee execution or prevent losses.
Grid Bot vs DCA Bot: 7 Critical Differences, Costs & Risk
Grid bot vs DCA bot is a choice about how orders build, reduce and recycle a position. A spot grid trades between price levels. A price-triggered DCA trading bot adds planned entries and usually manages their combined exit. Both can lose money, including while a dashboard highlights profitable completed trades.
This grid bot vs DCA bot guide separates trading bots from scheduled dollar-cost averaging, calculates trading costs and compares three transparent $1,000 scenarios. The examples expose capital and exit assumptions; they are not historical backtests, platform performance claims or forecasts.
Quick Answer: Grid Bot vs DCA Bot
Study a spot grid when your tested rules depend on repeated movement between defined levels. Study a price-triggered DCA bot when you deliberately plan staged entries into one position and can fund the entire sequence. Use a separate recurring-purchase plan when your objective is buying a fixed dollar amount on a schedule.
Neither trading bot is automatically safer or more profitable. Compare total account equity, maximum capital committed, fees and the response to a failed market thesis.
Affiliate disclosure: TradeboticsAI may receive compensation if you complete a qualifying action through a labeled affiliate link. This commercial relationship is separate from the hypothetical calculations and does not establish a platform’s suitability or profitability.
Review the software after defining the strategy. Bitsgap documents both GRID and DCA bots; check your exchange, available settings and plan before subscribing.
Explore Bitsgap GRID & DCA Bots
Affiliate link. Exchange and product availability depend on your location and account.
Grid Bot vs DCA Bot: Define the Strategy First
A useful grid bot vs DCA bot comparison starts with the trigger for the next order. The label “DCA” is used for different products, and confusing them can leave a trader with much more exposure than intended.
Spot grid: trade repeated price crossings
A conventional spot grid places orders across a price range. A filled buy can generate a sell above it; a filled sell can generate another buy below it. Some implementations purchase an initial inventory at launch. That inventory is exposed to price changes immediately.
Bitsgap’s GRID documentation describes predefined levels and replacement orders, while identifying strong directional moves as a risk. Repeated crossings matter: a fast decline is volatile, but it may complete very few profitable round trips.
DCA trading bot: accumulate a position under explicit rules
In this guide, a long DCA trading bot begins with an entry, adds purchases at specified lower prices and seeks an exit for the combined position. Providers may call the additions averaging orders or safety orders. The word “safety” does not mean that an order reduces the dollars you can lose.
Averaging orders can have equal or increasing sizes. Increasing them is a separate sizing choice, not a defining requirement of every DCA system. The Pionex comparison explicitly discusses its DCA/Martingale product, so its terminology should not be applied automatically to every provider.
Scheduled DCA: a different objective
Buying a fixed amount every Friday is time-based accumulation. It does not inherently include falling-price triggers, a take-profit target or position-size multipliers. In the grid bot vs DCA bot decision, identify whether you actually need an accumulation schedule or an active trading strategy.
Grid Bot vs DCA Bot: 7 Critical Differences
This grid bot vs DCA bot table describes conventional, unleveraged long strategies. Trailing grids, reverse grids, short strategies and derivatives can change the mechanics. Verify the actual order rules rather than assuming that a product name specifies them.
| Difference | Spot grid | Price-triggered DCA trading bot |
|---|---|---|
| 1. Entry trigger | Price reaches configured levels; initial inventory may be purchased. | An initial entry followed by specified averaging triggers. |
| 2. Exit unit | Individual lots can sell at different grid levels. | The accumulated position usually has a combined exit rule. |
| 3. Capital deployment | Inventory plus cash reserved for additional buys. | Initial order plus the entire planned averaging ladder and fees. |
| 4. Required price behavior | Enough two-way crossings to complete trades after costs. | A move to the combined exit after whatever entries have filled. |
| 5. Main stress case | Price leaves the range while inventory remains exposed. | The averaging ladder fills and the decline continues. |
| 6. Cost sensitivity | Small grid spacing can be consumed by two execution fees. | Fees apply to every entry and the larger eventual exit. |
| 7. Honest scorecard | Total equity, inventory, drawdown and all costs. | Total equity, committed capital, drawdown and time in the position. |
The grid bot vs DCA bot distinction does not identify a universal winner. A strategy can match its intended market behavior and still fail because of costs, poor fills or an incorrect assumption about future prices.
Grid Bot vs DCA Bot: Three Transparent $1,000 Scenarios
We calculated the following grid bot vs DCA bot examples from explicit order rules. Both start with a $1,000 cash allocation and a hypothetical asset priced at $100. Each execution pays a 0.10% fee in cash. Remaining inventory is sold at the final price, with another 0.10% fee.
These are synthetic arithmetic scenarios. They use ideal fills along continuous price paths, zero slippage and no subscription, tax, funding or borrowing costs. They are not tests of Bitsgap or any other product. No probabilities or time periods are assigned to the paths.
Show the exact rules used in the calculations
Grid: four independent two-unit slots use buy/sell pairs of $80/$90, $90/$100, $100/$110 and $110/$120. At launch, buy four units at $100 to seed the two upper slots, allocating two units to each. The two lower slots initially hold cash for their respective buys. Cash after initialization is $599.60.
When an active buy fills, its two units become available for sale at that slot’s upper price. When a sell fills, that slot waits to buy again at its lower price. Orders execute when the price path reaches their levels in the appropriate direction. No trailing, compounding, leverage or stop is used.
DCA: buy $200 of the asset at $100. Add $300 at $90 and $400 at $80 if those levels are reached. After each entry, set an exit for the entire position at 1% above its volume-weighted average purchase price, excluding fees. Stop after the first completed position; do not restart. Cash fees are paid in addition to those order amounts.
Holding benchmark: invest the same $1,000, including the entry fee, at $100. Buy approximately 9.99001 units, hold them through the path and sell at the final price with the same exit fee. Idle cash earns no interest in any strategy.
Every listed path is processed in order. These particular settings are chosen to make the accounting reproducible, not because they are recommended or optimized.
| Hypothetical price path | Grid | DCA | Buy and hold |
|---|---|---|---|
| Range: 100 → 90 → 100 → 90 → 100 | +$38.44 | +$4.00 | −$2.00 |
| Rally: 100 → 110 → 120 → 140 | +$59.14 | +$1.60 | +$397.20 |
| Decline: 100 → 90 → 80 → 60 | −$261.22 | −$281.52 | −$401.20 |
What the examples demonstrate
In the range example, the grid recycles the $90/$100 slot twice. Each two-unit round trip produces $20 before fees and $19.62 after them. Subtract the $0.40 initialization fee and $0.40 final inventory-sale fee to obtain $38.44.
The DCA bot closes its first combined position and remains in cash. Allowing automatic restarts would create a different experiment. In the rally, both trading rules reduce exposure early and miss much of the continued rise captured by holding.
In the decline, the grid ends with eight units and $259.26 cash. Selling those units at $60 yields $479.52 after the exit fee, leaving $738.78. The DCA position has approximately 10.33333 units and $99.10 cash; its final account value is $718.48.
Interpretation limit: equal starting budgets do not mean equal exposure. The grid initially buys $400, DCA buys $200 and the holding benchmark invests nearly all available cash. These outcomes explain mechanics; they do not show that one strategy has superior expected or risk-adjusted returns.
For a fair grid bot vs DCA bot performance study, also compare maximum and average exposure, time invested, drawdowns and behavior across unseen historical periods. Three selected paths cannot establish a trading edge.
Grid Bot vs DCA Bot Fees: Calculate the Break-Even Point
Fees can change a grid bot vs DCA bot decision before either bot trades. A small positive price difference does not necessarily cover two executions. Subscription costs create a separate hurdle even when individual trades are profitable.
An exact spot-grid round-trip formula
Assume the same asset quantity is bought and sold, with both fees paid in quote currency. Let B be the buy notional before fees, g the proportional price increase, and fb and fs the buy and sell fee rates expressed as decimals.
Net cycle P&L = B × [(1 + g) × (1 − fs) − (1 + fb)]
Fee-only break-even g = (1 + fb) ÷ (1 − fs) − 1
At 0.10% per side, the fee-only break-even step is approximately 0.2002002%. A 0.20% step is slightly below it because the sale fee is charged on a larger notional. This calculation excludes slippage and any software allocation.
| Price increase | Gross gain | Combined fees | Net cycle result |
|---|---|---|---|
| 0.10% | $0.1000 | $0.2001 | −$0.1001 |
| 0.20% | $0.2000 | $0.2002 | −$0.0002 |
| 0.40% | $0.4000 | $0.2004 | +$0.1996 |
| 1.00% | $1.0000 | $0.2010 | +$0.7990 |
Fees charged in the base asset or a discount token require adjustments. A limit order is not automatically a maker fill: an immediately marketable order can incur a taker fee. Use the actual execution report, including fee currency, rather than a generic advertised rate.
Subscription, spread and exit costs
A hypothetical $20 monthly subscription equals 2% of a $1,000 allocation or 0.4% of a $5,000 allocation each month. Those are cost burdens, not return targets or a quoted Bitsgap plan. Annual billing may also commit cash before a strategy has been validated.
In a grid bot vs DCA bot cost audit, include any paid signals, hosting, forced conversions, minimum order sizes and final liquidation. If you calculate profit from actual fill prices, spread and slippage are already reflected in those prices; do not deduct the same execution loss twice.
Grid Bot vs DCA Bot Capital: Budget the Entire Ladder
The initial order is only one part of the grid bot vs DCA bot capital comparison. A DCA configuration can reserve modest cash or demand rapidly increasing amounts, depending on its averaging-order sizes.
| Entry | Buy notional | Units added | Cumulative notional |
|---|---|---|---|
| $100 | $200 | 2.00000 | $200 |
| $90 | $300 | 3.33333 | $500 |
| $80 | $400 | 5.00000 | $900 |
Total purchased quantity is approximately 10.33333 units. The average purchase price, excluding fees, is $900 ÷ 10.33333 ≈ $87.09677. The model’s gross 1% exit target is approximately $87.96774. At $60, the lower average entry does not prevent a substantial loss.
This is the key grid bot vs DCA bot capital lesson: lowering average entry and lowering financial risk are different outcomes. More units can increase the dollars lost during the next price decline.
How order-size multipliers change the budget
For initial order A, first averaging order B, multiplier m and N averaging orders, the planned buy notional is:
C = A + B × (m^N − 1) ÷ (m − 1) when m ≠ 1; with equal orders, C = A + N × B.
With a $100 initial order and four averaging orders beginning at $100, planned notional is $500 at a 1× multiplier, $912.50 at 1.5×, and $1,600 at 2×. Fees require additional funds. Specify whether a platform’s multiplier applies to quote amounts or asset quantities before using this formula.
For grids, minimum investment also depends on the number of levels, prices and exchange minimum order rules. A platform accepting a setup is not proof that its allocation or loss exposure is appropriate.
Check the complete settings before funding a bot. Compare initial inventory, averaging orders, exit behavior and the applicable subscription.
Review Bitsgap Bot Settings & Plans
Affiliate link. A software subscription does not establish a profitable trading strategy.
Grid Bot vs DCA Bot Results: Measure Total Equity
A dashboard can show completed grid gains while the unsold asset has lost more value. In the grid bot vs DCA bot comparison, use a consistent account-level measure, not whichever green number the interface emphasizes.
Net economic P&L = ending liquidation equity + withdrawals − deposits − starting equity − costs paid outside the account
Deposits and withdrawals here mean flows after the starting measurement. Ending liquidation equity includes cash and the net sale value of remaining assets. Costs already deducted from the account must not be subtracted again. Stablecoin balances also have their own valuation and issuer risks.
For example, $36 of completed gains after trading fees can coexist with a $145 inventory loss and $20 of separately paid software costs. The economic result is −$129. Realized gains do not cancel an open loss simply because the loss has not been closed.
Keep an export of orders, fills, fees and balance changes. Your grid bot vs DCA bot review should reconcile those records to account balances and explain any difference before judging performance.
Grid Bot vs DCA Bot: Best Uses, Pros and Cons
| Approach | Useful fit and advantages | Limitations and poor fits |
|---|---|---|
| Spot grid | Explicit range rules; repeated partial exits; visible order levels; potentially suitable for testing recurring price crossings. | Range failure, fee drag and inventory drawdowns. Poor fit for someone who cannot monitor exposure or wants uninterrupted participation in a rally. |
| Price-triggered DCA | Predefined staged entries; transparent capital ladder; a combined position and exit that can be modeled. | Exposure can grow during declines; capital can remain tied up; recovery may never occur. Poor fit when later orders depend on extra deposits. |
| Scheduled purchases | Simple recurring accumulation aligned with a time-based budget. | Continued asset-price risk and no inherent trading exit. Poor fit for someone seeking assured short-term income. |
For a beginner asking grid bot vs DCA bot, the first decision is whether the order and loss mechanics are understood. Fewer settings do not establish lower risk. A paper environment is useful for learning behavior without treating a successful demonstration as investment evidence.
Choose neither trading bot when exchange access is unclear, the full capital requirement is unaffordable, minimum orders make the setup impractical, or there is no written response to a persistent decline.
Grid Bot vs DCA Bot Risk: Spot, Futures and API Access
The grid bot vs DCA bot examples above use unleveraged spot positions. Futures introduce margin, liquidation and, for many perpetual contracts, funding payments. A spot simulation cannot validate a leveraged version of the same idea.
A spot grid’s lower boundary is not necessarily a stop-loss. Leaving the range can pause new trades while existing inventory continues losing value. Likewise, reaching the last DCA entry does not automatically close the position.
Write down what “stop” means in your platform: stop opening trades, cancel pending orders, sell inventory, close derivatives, or some combination. A stop-market order can slip; a stop-limit order may remain unfilled. Connectivity failures can interfere with software-managed exits.
API security is separate from strategy risk
Use only the permissions a bot requires, disable withdrawals, protect both accounts with strong authentication and apply supported IP restrictions. For an unleveraged spot strategy, do not enable unnecessary derivatives or borrowing permissions.
A trading-only API key can still expose the account to harmful trades. Keeping funds at an exchange does not eliminate exchange custody, account-compromise or execution risks. Test how to revoke access and independently cancel orders or close exposure on the exchange.
How to Test Grid Bot vs DCA Bot Fairly
A credible grid bot vs DCA bot study must specify both the trading rules and the accounting before inspecting the results. Attractive parameters chosen after seeing a chart can hide overfitting.
- Freeze the specification. Record the exchange, pair, initial allocation, inventory, grid levels or averaging ladder, exit, stop, restart and compounding rules.
- Use consistent data and costs. Include relevant fees, minimum quantities and plausible adverse fills. One candle touching two levels does not prove their intrabar execution order.
- Reserve unseen data. Separate development from out-of-sample evaluation. Use walk-forward periods when adapting parameters, without revising earlier decisions using later prices.
- Stress the mechanism. Examine prolonged declines, breakouts, price gaps, missed fills, wider spreads, unavailable APIs and insufficient free balances.
- Use comparable scorecards. Report net equity, maximum drawdown, exposure, turnover, time underwater, fees and a suitable holding or cash benchmark.
- Check sensitivity. Change grid spacing, entry sizes, averaging depth and costs. A result that disappears after a small parameter change is fragile.
- Reconcile forward paper results. Verify actual order states and balances. Simulated success does not establish live execution quality or future profitability.
For tools, see our backtesting software comparison. The Cornix demo documentation also illustrates the distinction between built-in simulated accounts and external exchange testnets. Do not assume all testing environments use identical fill or fee models.
The strongest grid bot vs DCA bot conclusion may be that neither tested configuration clears its cost and risk requirements. That is a valid research result, even when a platform makes both easy to launch.
Platform Checks After the Grid Bot vs DCA Bot Decision
Bitsgap is one option to investigate because its official guides document both GRID setup and DCA setup. Their historical-testing features have plan-dependent limits. This guide does not rank the provider or claim that its execution matches our synthetic model.
Before paying, verify the specific exchange connection, trading pair, bot type, concurrent-bot limit, historical-data window, reporting export, cancellation terms and monthly versus annual billing. A provider listing an exchange does not establish that every product is available to every account.
For U.S. readers, check country and state eligibility with both the bot provider and the exchange. Do not treat global product pages as confirmation that a particular derivatives service or exchange entity is available to you.
Once you have settled the grid bot vs DCA bot requirements, compare implementation choices in our crypto grid bot platform comparison and broader crypto trading bot guide.
Grid Bot vs DCA Bot FAQ
Which is more profitable: a grid bot or a DCA bot?
Neither is universally more profitable. Results depend on price paths, exposure, entry and exit rules, fees and execution. Our synthetic grid bot vs DCA bot examples demonstrate those dependencies; they do not estimate expected returns.
Is a DCA trading bot the same as dollar-cost averaging?
Not necessarily. Scheduled dollar-cost averaging makes recurring purchases. A price-triggered DCA trading bot adds entries when configured conditions occur and typically manages an exit for the combined position. Confirm the provider’s definition.
Can a grid bot show profits while losing money overall?
Yes. Completed grid trades can be profitable while unsold inventory loses more value. Include open positions, all trading costs, external software charges and cash flows when evaluating the total result.
How much money does a DCA bot need?
It needs enough for the initial order, every planned averaging order and applicable fees. Minimum order requirements and sizing rules vary. Increasing order multipliers can make the complete budget much larger than the first order.
Does a grid stop-loss equal the bottom of its range?
No. A range boundary and a stop-loss can be separate settings. A bot may stop placing new orders outside the range while keeping its inventory. Verify whether stopping also closes positions and cancels pending orders.
Can I run grid and DCA bots together?
Some systems allow it, but both bots can share the same market exposure and available balance. Combined allocation, overlapping orders and correlation matter more than the number of bots. Separate labels do not create diversification.
Are the $1,000 examples actual trading results?
No. They are reproducible calculations on hypothetical price paths, using the exact rules disclosed above. They include stated execution fees but exclude slippage, subscriptions and other real-world costs. They are not historical or live performance.
Final Verdict: Grid Bot vs DCA Bot
The practical grid bot vs DCA bot decision comes down to the position you intend to hold, the sequence of trades you expect and the loss you can face when the market behaves differently.
A grid is a structure for repeated trades between levels. A DCA trading bot is a structure for staged entries and a combined exit. Scheduled purchases serve a separate accumulation objective. None provides a shortcut around fees, capital limits or a failing thesis.
Start with written rules, calculate the full capital path and evaluate total equity after costs. Compare software only after it is clear what the software must do.
Ready to compare the implementation? Inspect the available bot controls, exchange connections and current terms against your written requirements.
Check Bitsgap Features & Current Plans
Affiliate link. Check eligibility and full costs before subscribing or connecting an account.
Sources, Methodology and Disclosures
Sources were reviewed on September 19, 2026. Provider documentation supports descriptions of product mechanics; it does not independently prove performance. TradeboticsAI calculated the synthetic scenarios from the disclosed rules, checked the fill accounting and rounded final dollar results to cents.
Further primary references include Cornix’s arithmetic, geometric and custom grid settings and the CFTC advisory on automated-trading and AI return claims. The CFTC warns against promises of unusually high or guaranteed bot returns and highlights the impact of costs.
Arithmetic grids use fixed price differences; geometric grids use fixed ratios. Provider features, fees, supported exchanges and regional availability can change. Verify the applicable configuration in current documentation and your own account.
Affiliate disclosure: The three Bitsgap buttons are affiliate links. TradeboticsAI may receive compensation for qualifying referrals. Other linked provider documentation is included as an editorial reference. We do not claim firsthand live performance testing of the platforms in this article.
Risk disclosure: This content is educational and is not personalized investment, legal or tax advice. Cryptocurrency trading can result in loss of the entire amount committed. Leveraged products can introduce liquidation and losses beyond initial margin, depending on the product and applicable protections. Hypothetical examples and backtests do not predict future results. Automated orders, security controls and stop settings do not guarantee execution or prevent losses.