Futures Cumulative Delta 2026: CVD, Divergence & Order Flow Guide
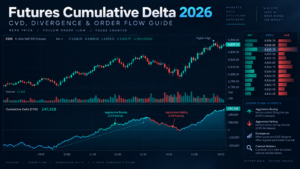
Futures Cumulative Delta tracks the running difference between aggressive buying and aggressive selling activity over time. Instead of looking at one candle’s delta in isolation, CVD accumulates that information so traders can compare order-flow pressure with price structure. When price and CVD move together, aggressive participation may be confirming the move. When they diverge, the relationship can reveal absorption, weakening aggression, or a market being driven by passive liquidity rather than by aggressive orders alone.
Quick Answer
Futures Cumulative Delta is a running total of volume delta. A common bid/ask calculation defines delta as ask-side traded volume minus bid-side traded volume. Each new bar’s delta is added to the prior cumulative value. Rising CVD shows that aggressive buying has dominated the selected period; falling CVD shows stronger aggressive selling. The most useful information often comes from how CVD behaves relative to price—not from whether the number is simply positive or negative.
Explore NinjaTrader for Cumulative Delta, futures charts and simulated order-flow analysis
Affiliate Disclosure: TradeboticsAI may earn compensation when an eligible user completes a qualifying action through an affiliate link, at no additional cost to the user. Affiliate relationships do not determine our editorial conclusions.
What Is Futures Cumulative Delta?
Futures Cumulative Delta is an order-flow indicator designed to accumulate delta across multiple trades or bars. NinjaTrader defines its Order Flow Cumulative Delta indicator as a tool that accumulates volume filled at bid and ask prices—or alternatively by up/down tick classification—and compares that information to evaluate buying and selling pressure.
At the simplest level, a trader first calculates delta for an individual bar:
Bar Delta = Ask-Side Volume − Bid-Side Volume
The result is then added to the prior cumulative value:
CVDt = CVDt−1 + Deltat
If a sequence of bars produces +350, +620, -200 and +430 delta, a session starting from zero would progress approximately as follows:
| Bar | Bar Delta | Running CVD |
|---|---|---|
| 1 | +350 | +350 |
| 2 | +620 | +970 |
| 3 | -200 | +770 |
| 4 | +430 | +1,200 |
This running total is why Futures Cumulative Delta can reveal information that a single footprint bar cannot. A footprint tells you what happened inside a specific candle or price area; CVD shows whether aggressive pressure has been building, fading, or reversing across a broader sequence.
Official reference:
NinjaTrader Order Flow Cumulative Delta documentation.
How Futures Cumulative Delta Is Calculated
The exact calculation behind Futures Cumulative Delta depends on the platform and data methodology. On a bid/ask implementation, trades executed at the offer are generally classified as aggressive buying and trades executed at the bid as aggressive selling.
A simplified example:
- Ask-side volume: 8,400 contracts
- Bid-side volume: 7,100 contracts
- Delta: +1,300
If the previous cumulative value was +4,250, the new value becomes +5,550.
A positive number does not mean that “there were more buyers than sellers.” Every completed futures transaction contains both sides. It means more volume was executed aggressively against offers than against bids under the classification model being used.
This distinction is essential. Futures Cumulative Delta measures aggression, not the total number of market participants and not which side will ultimately control the next price move.
Bar Delta vs Futures Cumulative Delta
Bar delta and Futures Cumulative Delta answer different questions. Bar delta isolates a single candle. CVD connects those candles into a running order-flow history.
| Metric | Measures | Best Question | Main Limitation |
|---|---|---|---|
| Bar Delta | Ask minus bid activity for one bar | Who was more aggressive during this candle? | Can be noisy in isolation |
| Cumulative Delta | Running sum of delta | How has aggressive pressure evolved? | Depends on reset point and data methodology |
| Footprint Delta | Delta at individual prices inside a bar | Where inside the candle did aggression occur? | Very information-dense |
This is why Futures Cumulative Delta pairs naturally with our Futures Footprint Charts 2026 guide. The footprint provides micro-level detail while CVD summarizes whether aggressive flow is persisting across the broader session.
Futures Cumulative Delta: Price vs CVD Interpretation Matrix
The greatest information gain often comes from comparing price behavior with Futures Cumulative Delta rather than reading CVD independently.
| Price | CVD | Possible Interpretation | What to Check Next |
|---|---|---|---|
| Rising | Rising | Aggressive buying broadly confirms price advance | Volume, structure, resistance and follow-through |
| Rising | Falling / flat | Price is advancing without matching aggressive-buy confirmation | Passive buying, short covering, absorption, thin liquidity |
| Falling | Falling | Aggressive selling broadly confirms price decline | Support, exhaustion and pace of selling |
| Falling | Rising / flat | Price decline is not confirmed by comparable aggressive selling | Absorption, passive selling, liquidation dynamics |
This framework is deliberately conditional. Futures Cumulative Delta divergence can persist for a long time. Price can continue higher while CVD falls, or continue lower while CVD rises. Divergence identifies disagreement; it does not supply a guaranteed reversal timestamp.
Futures Cumulative Delta Divergence Explained
CVD divergence occurs when price and Futures Cumulative Delta move differently. NinjaTrader educational material specifically demonstrates divergence as one potential way traders compare price with order-flow pressure, while warning that cumulative delta can produce false signals.
Bullish CVD Divergence
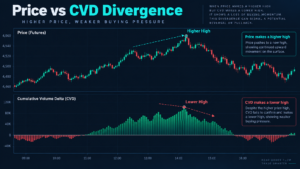
A simplified bullish divergence occurs when price makes a lower low while CVD makes a higher low. One possible interpretation is that the new price low required less aggressive selling than the previous low. That can indicate weakening sell-side aggression or increased passive buying.
Bearish CVD Divergence
A simplified bearish divergence occurs when price makes a higher high while CVD makes a lower high. Aggressive buying is failing to confirm the higher price extreme. This can occur because passive sellers are absorbing buys, because liquidity is thin, or because the move is being driven by mechanisms not captured cleanly by the chosen CVD calculation.
The quality of a Futures Cumulative Delta divergence usually improves when it occurs at a meaningful location such as a prior session extreme, VAH, VAL, Volume POC, Initial Balance edge, or another objectively defined market reference.
See Futures Volume Profile 2026 and Futures Market Profile 2026 for broader location and auction context.
Futures Cumulative Delta and Absorption
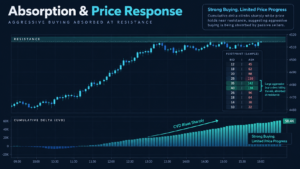
One of the most useful applications of Futures Cumulative Delta is identifying situations where aggressive activity is substantial but price barely responds.
Suppose ES is trading near a major resistance level. CVD rises rapidly by +8,000 contracts while price advances only two points and repeatedly fails at the same high. Aggressive buyers are clearly lifting offers, yet the market is not moving proportionally higher.
One possible explanation is absorption: passive sell liquidity is accepting the buying pressure. Importantly, CVD does not directly show the resting seller’s identity. The inference comes from the mismatch between aggressive flow and price response.
The opposite can occur near support. Futures Cumulative Delta may collapse as aggressive sellers hit bids, yet price refuses to continue lower. That can suggest passive buyers are absorbing the selling.
This relationship is more informative than a simplistic rule such as “positive CVD = bullish.” Strong positive CVD with poor upward price response can sometimes be more significant than positive CVD accompanied by an orderly rise.

Session vs Bar Futures Cumulative Delta
NinjaTrader documents two display periods for its Order Flow Cumulative Delta tool: Session and Bar.
Session Cumulative Delta
In Session mode, Futures Cumulative Delta accumulates over the trading session. The closing cumulative value of one bar carries into the opening value of the next bar. This creates the continuous CVD structure most traders associate with session-level order-flow analysis.
Bar Delta Display
In Bar mode, the calculation restarts from zero for every individual bar. The result resembles a delta histogram or candle-by-candle order-flow display rather than one continuous session total.
| Mode | Reset | Best Use |
|---|---|---|
| Session | Session boundary | Broader order-flow pressure and divergences |
| Bar | Every bar | Isolating sudden changes in bar-level aggression |
Reset choice changes the interpretation. A +15,000 Futures Cumulative Delta reading has little meaning without knowing whether it accumulated since the regular-session open, overnight session, a custom start time, or another platform-defined period.
Why Futures Cumulative Delta Can Differ Between Platforms
This is one of the most important details for serious Futures Cumulative Delta analysis: two platforms can display different CVD even when they appear to be showing the same market.
NinjaTrader supports Bid/Ask and Up/Down Tick delta types. Its developer documentation describes BidAsk Cumulative Delta as an accumulation of orders filled at the bid and ask, while UpDownTick uses a different classification method.
TradingView’s Cumulative Volume Delta uses lower-timeframe intrabar volume and price fluctuations to estimate buying and selling pressure. It categorizes lower-timeframe volume as positive or negative based on price movement and then accumulates those values.
These approaches should not be assumed to produce identical numbers.
| Implementation | Underlying Method | Key Implication |
|---|---|---|
| NinjaTrader Bid/Ask | Volume filled at bid vs ask | Order-flow classification tied to bid/ask trade information |
| NinjaTrader Up/Down Tick | Tick-direction classification | Can differ from bid/ask classification |
| TradingView CVD | Intrabar volume + price-change classification | Provides an estimate rather than the same bid/ask methodology |
Official reference:
TradingView Cumulative Volume Delta documentation.
Therefore, do not judge one Futures Cumulative Delta platform as “wrong” merely because its value does not numerically match another tool. First compare the data feed, classification method, session template, timeframe and reset rules.
Practical Futures Cumulative Delta Example: ES
Consider a hypothetical ES session. The prior-day VAH is 6,620.00. ES opens below it, rallies through 6,620.00 and eventually prints a new session high at 6,632.00.
During the first advance, Futures Cumulative Delta rises from zero to +18,500. Price and CVD are moving together.
Later, ES pulls back and then prints a new high at 6,634.00. This time CVD reaches only +11,200 rather than exceeding its prior peak.
That produces a bearish divergence:
- Price: higher high
- CVD: lower high
- Location: above prior value
- Interpretation: aggressive buying is weaker than during the first advance
The divergence alone is not enough to short. Suppose a footprint chart then shows repeated ask-side volume at 6,633.50–6,634.00 without further price progress, followed by a negative-delta bar that closes back below 6,630.00.
The combined evidence is stronger because different tools are answering different questions. Futures Cumulative Delta identifies weakening session-level aggressive buying. The footprint shows what happened at the exact high. Price confirms that the market failed to remain at the new extreme.
For the footprint component, see Futures Footprint Charts 2026.
A Practical Futures Cumulative Delta Trading Workflow
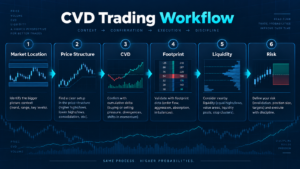
Use this process to prevent Futures Cumulative Delta from becoming another indicator that generates random trades:
- Confirm the active contract. During rollover, use the contract carrying relevant liquidity.
- Define the session. Know exactly when CVD resets and whether overnight activity is included.
- Identify market location first. Prior high/low, VAH, VAL, POC, Initial Balance and other references provide context.
- Observe price structure. Determine whether the market is trending, balancing, breaking out or rejecting an area.
- Compare price with CVD. Look for confirmation or sustained disagreement.
- Investigate divergence. Ask whether passive liquidity, exhaustion or thin conditions could explain the mismatch.
- Use footprint detail when needed. Inspect the specific price levels driving the divergence.
- Check current volume and liquidity. CVD should not replace spread, depth and execution awareness.
- Define invalidation before entry. A divergence is not a stop-loss methodology.
- Review the setup afterward. Save screenshots of price, CVD and the exact market location to build a real dataset instead of relying on memory.
Explore NinjaTrader for Cumulative Delta, Volumetric Bars and futures simulation
Common Futures Cumulative Delta Mistakes
1. Assuming Rising CVD Means Buy
Rising Futures Cumulative Delta means aggressive buying has dominated the selected calculation period. Passive sellers can still absorb that buying and prevent price from advancing.
2. Assuming Falling CVD Means Sell
Falling CVD shows aggressive selling pressure. If price refuses to move lower, the selling may be getting absorbed by passive buyers.
3. Trading Every Divergence
Short-lived divergence occurs frequently. It becomes more useful when sustained and when it develops at a meaningful market location.
4. Ignoring the Session Reset
A CVD value cannot be interpreted properly without knowing where the accumulation began. Different sessions can produce very different baselines.
5. Comparing Different Platforms Numerically
Bid/ask delta, up/down tick delta and intrabar-estimated CVD use different methodologies. Exact values are not necessarily transferable between tools.
6. Ignoring Contract Rollover
Order-flow data can migrate rapidly to the next futures expiration. Verify the active contract with our Futures Rollover Dates 2026 guide.
7. Treating Aggression as Control
Aggressive traders can be wrong. Futures Cumulative Delta reveals which side is crossing the spread more aggressively, while price tells you whether that aggression is actually producing progress.
Pros and Limitations of Futures Cumulative Delta
Pros
- Summarizes aggressive order flow across multiple bars.
- Makes price/order-flow divergence easier to identify.
- Can help contextualize absorption and exhaustion.
- Pairs naturally with footprint charts.
- Useful for trend confirmation and failed-break analysis.
- Provides more context than bar delta alone.
Limitations
- Not a standalone directional signal.
- Reset point materially affects interpretation.
- Different calculation methods produce different values.
- Divergence can persist without reversal.
- Passive liquidity is inferred rather than directly identified.
- Requires reliable market data for high-quality analysis.
Who Is Futures Cumulative Delta Best For?
Futures Cumulative Delta is most useful for active futures traders who already understand price structure and want to add an order-flow layer to their analysis. It can be particularly relevant for liquid centralized contracts such as ES, NQ, MES, MNQ, CL and GC.
It is less useful for traders searching for a mechanical green-line/red-line system. CVD needs context. A trader should understand the contract, session, rollover, tick value, liquidity and risk before interpreting a delta divergence as actionable information.
For broader participation data, see Futures Open Interest 2026. Open interest measures outstanding contracts, whereas CVD measures transaction-side aggression over the selected period.
Futures Cumulative Delta FAQ
What is Futures Cumulative Delta?
Futures Cumulative Delta is the running total of volume delta across a selected period. In a bid/ask implementation, delta commonly represents ask-side traded volume minus bid-side traded volume.
What does positive cumulative delta mean?
Positive or rising CVD means aggressive buying volume has exceeded aggressive selling volume over the selected accumulation period. It does not guarantee that price will rise.
What does negative cumulative delta mean?
Negative or falling CVD means aggressive selling volume has dominated under the chosen calculation. Passive buyers can still absorb that selling and prevent price from declining.
What is CVD divergence?
CVD divergence occurs when price and Futures Cumulative Delta fail to confirm each other. Examples include price making a higher high while CVD makes a lower high, or price making a lower low while CVD makes a higher low.
Is CVD divergence a reversal signal?
Not by itself. Divergence highlights disagreement between price and measured aggressive flow. It can persist and should be combined with location, price response and risk controls.
What is the difference between delta and cumulative delta?
Delta describes the imbalance for one price level or bar. Cumulative delta adds successive delta values together to show how aggressive pressure develops over time.
Why is my cumulative delta different on another platform?
Platforms can use different feeds, session boundaries and classification methodologies. NinjaTrader supports Bid/Ask and Up/Down Tick methods, while TradingView’s CVD uses intrabar volume and price fluctuations to estimate positive and negative volume.
Does cumulative delta measure limit orders?
Not directly. CVD primarily describes classified executed volume. Passive liquidity becomes relevant when traders compare the aggressive activity with the actual resulting price movement.
Can Futures Cumulative Delta be used with Volume Profile?
Yes. Volume Profile can identify meaningful volume-at-price locations, while Futures Cumulative Delta helps evaluate whether aggressive order flow confirms or contradicts price behavior around those areas.
Does NinjaTrader have Cumulative Delta?
Yes. NinjaTrader documents Order Flow Cumulative Delta as part of its Order Flow toolset, with Session and Bar periods and Bid/Ask or Up/Down Tick calculation types. Product access and pricing can change, so verify current plan availability directly with NinjaTrader.
Final Verdict: How to Use Futures Cumulative Delta Correctly
Futures Cumulative Delta is most powerful when treated as a relationship tool rather than a directional indicator. Its purpose is to show whether aggressive buying and selling activity is accumulating in a way that confirms—or contradicts—the price auction.
A rising line is not automatically bullish. A falling line is not automatically bearish. The valuable question is whether aggressive order flow is actually producing price progress.
When price advances with strong CVD confirmation, the move has one type of structure. When price advances while CVD deteriorates, another mechanism may be driving the auction. When enormous aggressive selling fails to break support, absorption becomes a reasonable hypothesis.
Combine CVD with meaningful location, footprint charts, Volume Profile, Market Profile, current liquidity and disciplined position sizing. That creates a more complete order-flow framework than any single indicator can provide.
Explore NinjaTrader for Cumulative Delta, Order Flow tools and futures simulation
Affiliate Disclosure: TradeboticsAI may receive compensation when eligible users complete a qualifying action through certain affiliate links. Affiliate relationships do not determine our editorial conclusions.
Risk Disclosure: Futures trading involves substantial risk of loss and is not suitable for every investor. Cumulative Delta, delta divergence, absorption and historical order-flow relationships do not predict future returns. Simulated and backtested results are hypothetical and do not guarantee future live performance. Nothing on this page is personalized investment, financial, tax or trading advice.