Futures Market Profile 2026: TPO, Initial Balance & Day Types Guide
Futures Market Profile organizes price by time instead of showing only a conventional sequence of candles. The method uses Time Price Opportunity (TPO) blocks to show where the market spent time, where it moved quickly, and how the session developed around the Point of Control (POC), Value Area High (VAH), Value Area Low (VAL), Initial Balance (IB), single prints, and profile distributions. For futures traders, the goal is not to predict every move. It is to build a structured map of acceptance, rejection, balance, and directional expansion.
Quick Answer
Futures Market Profile is a time-at-price framework. A TPO block records that price traded at a specific level during a defined time bracket. The POC is the price row with the greatest concentration of TPO blocks, the value area contains a chosen percentage of TPO activity, and the Initial Balance describes the early-session range. Market Profile differs from Volume Profile because TPO measures time spent at price, while Volume Profile measures contracts traded at price.
Explore NinjaTrader for futures charting, simulation and Order Flow tools
Affiliate Disclosure: TradeboticsAI may earn compensation when an eligible user completes a qualifying action through an affiliate link, at no additional cost to the user. Affiliate relationships do not determine our editorial conclusions.
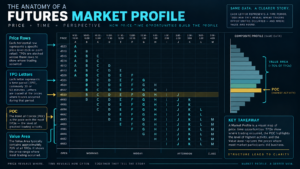
What Is Futures Market Profile?
Futures Market Profile is commonly used to describe a TPO-based view of market activity. TradingView’s official documentation describes TPO, also known as Market Profile, as a method developed from the work of J. Peter Steidlmayer at the Chicago Board of Trade in the 1980s. Instead of displaying only a linear time series, TPO builds a distribution that shows which price levels were visited during each defined time block.
The key idea is simple: time spent at a price can be treated as evidence of market acceptance. A price repeatedly revisited across several brackets builds a wider profile row. A price that is touched briefly and left behind creates a thinner row. The resulting shape gives traders another way to describe balance, imbalance, range extension, and the search for a new area of value.
Futures Market Profile should not be confused with an order book, footprint chart, or real-time measure of aggressive buying and selling. It is a structural representation built from price and time. It can be paired with volume, open interest, footprint data, and liquidity information, but those inputs answer different questions.
Official reference:
TradingView Time Price Opportunity (TPO) documentation.
How Futures Market Profile TPO Blocks Work
In a Futures Market Profile, each time bracket is represented by a letter or block. TradingView allows multiple block sizes and uses 30 minutes as its default. The classic educational approach often uses 30-minute periods because it provides enough detail to show how the session evolves without producing an excessively fragmented profile.
Imagine an ES session where the first time bracket trades from 6,600 to 6,612. Every configured price row visited during that bracket receives an “A” block. If the next bracket trades from 6,605 to 6,618, those rows receive a “B” block. Prices visited in both periods now contain both A and B, making those rows wider than prices visited only once.
| Price | TPO Letters | TPO Count | Interpretation |
|---|---|---|---|
| 6,618 | B | 1 | Brief visit |
| 6,612 | A B C | 3 | Repeated acceptance |
| 6,608 | A B C D | 4 | Stronger time concentration |
| 6,600 | A | 1 | Brief visit |
The example is deliberately simplified. Actual platforms can aggregate multiple ticks into one row, use different block sizes, and apply platform-specific rules when drawing the profile. That is why Futures Market Profile screenshots from two traders can differ even when both are analyzing the same contract and session.
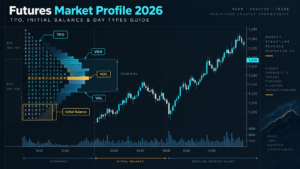
Futures Market Profile POC, VAH and VAL
The POC and value area are core reference points in Futures Market Profile analysis, but they must be interpreted as calculated structure rather than guaranteed support or resistance.
| Level | Meaning in TPO | What It Can Tell You | Main Limitation |
|---|---|---|---|
| TPO POC | Price row containing the greatest concentration of TPO blocks | Where the market spent the most profile time | May differ from Volume POC |
| VAH | Upper boundary of the calculated TPO value area | Upper edge of the main acceptance region | Depends on settings and calculation method |
| VAL | Lower boundary of the calculated TPO value area | Lower edge of the main acceptance region | Can be crossed without reversal |
TradingView’s TPO implementation uses a configurable value-area percentage and documents 70% as the default. The algorithm starts from the POC row and expands until the target number of TPO blocks is included. That means the value area is a statistical concentration defined by the profile settings, not an exchange-published support or resistance zone.
This is also where Futures Market Profile differs from the Volume Profile page we use elsewhere on TradeboticsAI. A TPO POC is based on time-block concentration. A Volume POC is based on traded volume concentration. They can align, but they can also diverge.
For the volume-at-price framework, see our Futures Volume Profile 2026 guide.
Initial Balance in Futures Market Profile
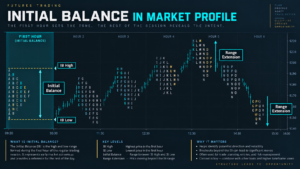
The Initial Balance is the early price range used as a structural reference for the rest of the profile period. In the common 30-minute TPO convention, traders often define the first two brackets as the first hour of the session. Platforms can make this configurable, so the session template and block definition should always be documented.
Suppose ES regular trading opens at 6,600. During the first hour, the high is 6,620 and the low is 6,590. The Initial Balance is therefore 30 points wide. If price later extends to 6,635 without breaking below 6,590, the market has created a 15-point upside range extension beyond the Initial Balance high.
Futures Market Profile traders use the Initial Balance to describe how the session is developing rather than to assume a breakout must succeed. A narrow early range can later expand sharply. A wide early range can contain most of the session. News, overnight positioning, volatility, and the contract being traded all affect how useful the reference becomes.
TradingView describes the Initial Balance Range as the prices visited during the first configured time blocks of the profile period. That definition is more precise than treating “first hour” as a universal rule across all markets and sessions.
Single Prints, Excess, Poor Highs and Poor Lows
One advantage of Futures Market Profile is that it makes unusual time-at-price structure visually obvious. Two examples are single prints and poor extremes.
Single Prints
TradingView defines single prints as non-extreme price rows that contain only one TPO block. The market traversed those rows during only one bracket in the profile period. In practical terms, the profile shows that price moved through the area quickly rather than repeatedly returning to it.
That can make single prints useful as evidence of directional urgency or imbalance, but the interpretation should remain conditional. A single-print zone can remain untouched, be partially tested, or be completely traversed later. It is not a guaranteed “fill” target.
Poor Highs and Poor Lows
A poor high or poor low is an extreme that lacks a clean taper or clear rejection. TradingView describes poor highs and lows as profile extremes containing more than one TPO block, creating a flatter or narrower ending structure. Traders may monitor them because the auction can appear unfinished, but the level is not automatically strong support or resistance.
Excess
“Excess” is often used by Market Profile practitioners to describe a more decisive taper or rejection at a profile extreme. Platform terminology varies, so TradeboticsAI treats it as an editorial concept rather than a fixed universal formula. The useful question is whether price was clearly rejected at the extreme or whether the auction ended without strong separation.
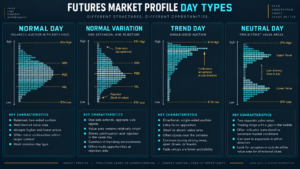
Common Futures Market Profile Day Types
Day-type labels help summarize how the auction developed. They are descriptive categories, not a forecasting system. TradingView’s official TPO documentation discusses normal, normal variation, trend, and neutral distributions.
| Day Type | Typical Structure | What to Observe | Do Not Assume |
|---|---|---|---|
| Normal Day | Much of the final range remains inside the Initial Balance | Two-sided trade and relative balance | That the next session must also balance |
| Normal Variation | Range extends beyond the Initial Balance without extreme directional expansion | Outside participation and range extension | That every extension is a trend day |
| Trend Day | Successive directional range expansion with limited rotation | Acceptance away from prior value and directional control | That late entries have favorable risk |
| Neutral Day | Extensions can occur on both sides of the Initial Balance | Competing directional attempts and uncertainty | That both extensions will persist |
Futures Market Profile day types are most useful after the trader defines objective criteria. If every session can be relabeled after the fact, the framework becomes hindsight rather than analysis. Document the Initial Balance, extensions, close location, and profile shape before assigning a label.
Futures Market Profile vs Volume Profile
This distinction is essential because the two profiles often look similar while measuring different things. Futures Market Profile measures time at price using TPO blocks. Volume Profile measures contracts traded at price.
| Feature | Market Profile / TPO | Volume Profile |
|---|---|---|
| Measures | Time spent at price | Contracts traded at price |
| Typical display | Letters or TPO blocks | Horizontal volume histogram |
| POC | Highest TPO concentration | Highest traded-volume concentration |
| Best question | Where did price spend time? | Where did contracts trade? |
| Can they disagree? | Yes | Yes |
A price can remain active across many time brackets but trade relatively modest volume, producing a strong TPO concentration without the same strength in Volume Profile. The opposite can also occur: a brief burst of extremely heavy volume can create a Volume POC or HVN without a comparable amount of time spent there.
For that reason, Futures Market Profile and Volume Profile can complement one another rather than compete. TradingView even allows an optional volume profile beside the TPO profile so the user can compare price-time concentration with volume-at-price concentration.
Practical Futures Market Profile Example: ES Session
Consider a hypothetical ES session with the following completed prior-day references:
- Prior VAH: 6,620.00
- Prior TPO POC: 6,608.00
- Prior VAL: 6,596.00
- Prior session high: 6,630.00
- Prior session low: 6,588.00
The next session opens at 6,624.00, above prior VAH. During the first hour, price trades between 6,618.00 and 6,636.00, creating an 18-point Initial Balance. A weak approach would conclude “open above value means buy.” A stronger Futures Market Profile process asks whether the market is actually accepting the higher prices.
Suppose the next two TPO periods repeatedly trade from 6,626 to 6,640, while the developing TPO POC migrates upward from 6,626 to 6,633. That is different from a session that briefly opens above prior VAH and then spends the next hour back inside yesterday’s value area. The first case shows time building at higher prices; the second shows failure to maintain acceptance above prior value.
Now add risk context. If the planned entry is 6,636 with an invalidation at 6,626, the stop distance is 10 ES points. The profile does not decide whether that dollar risk is acceptable. Contract specifications, account size, volatility, and position sizing still control the trade decision.
For tick value and contract mechanics, see Futures Contract Specifications 2026.
A Practical Futures Market Profile Trading Workflow
Use this process to keep Futures Market Profile analysis reproducible:
- Confirm the active contract. Near rollover, make sure the contract you are profiling is still the one carrying relevant liquidity.
- Define the session. Decide whether you are analyzing regular trading hours, the full electronic session, or a custom session.
- Set the TPO block size. Thirty minutes is common, but platforms can support other values.
- Set ticks per row. Different row aggregation changes the visual profile and can shift POC/value boundaries.
- Record prior VAH, POC and VAL. Do this before the new session to reduce hindsight bias.
- Mark the Initial Balance. Track later range extensions relative to that early range.
- Watch developing value. Observe whether the POC and value area migrate higher, lower, or remain balanced.
- Identify single prints or poor extremes. Treat them as structural context, not guaranteed targets.
- Compare with volume and liquidity. Add Volume Profile, spread, depth and current participation when useful.
- Define risk independently. Market structure does not replace position sizing, stop logic or margin planning.
During index-futures rollover weeks, use our Futures Rollover Dates 2026 guide to verify the active quarterly contract before building session comparisons.
Explore NinjaTrader for futures charts, simulation and advanced market analysis
Futures Market Profile Settings and Platform Differences
One of the biggest practical problems with Futures Market Profile is assuming every chart calculates the same output. They do not necessarily use identical defaults.
TradingView documents a default 30-minute TPO block size and a default 70% value area for its TPO indicator. It also lets users change the block size, ticks per row, profile period, Initial Balance block count, and other settings. Other platforms may use different defaults or terminology.
NinjaTrader educational material also discusses Market Profile and shows how its Order Flow Volume Profile can be configured to display profile information with letter-based presentation. Because software features and plan access can change, verify the current platform documentation before choosing software solely for a specific TPO feature.
When sharing a Futures Market Profile level, record at minimum:
- contract symbol and expiration;
- date and session template;
- TPO block size;
- ticks per row;
- value-area percentage;
- whether the profile is completed or still developing;
- whether the quoted POC is TPO-based or volume-based.
This small checklist prevents a common problem: two traders debating different POC or value-area levels when their chart settings were never the same.
Common Futures Market Profile Mistakes
1. Confusing TPO POC With Volume POC
A TPO POC measures the highest concentration of time blocks. A Volume POC measures the highest concentration of traded contracts. The two can differ.
2. Treating Value Area as Guaranteed Support and Resistance
VAH and VAL are structural reference levels. New information can move price through them without producing a meaningful reversal.
3. Using the Wrong Session
A regular-hours profile can look very different from a full electronic-session profile. Session selection should match the strategy being evaluated.
4. Assuming Every Initial Balance Is Exactly One Hour
The first hour is a common convention when two 30-minute TPO blocks are used. Modern platforms can configure the block size and Initial Balance definition, so document the actual settings.
5. Treating Single Prints as Guaranteed Fill Targets
Single prints show a one-block area of the profile. They can attract future attention, but there is no rule requiring price to revisit them.
6. Labeling the Day Only After the Outcome
If “trend day,” “neutral day,” or another category is assigned only after the session ends, the label can become hindsight. Use objective criteria and record the reasoning.
7. Ignoring Contract Rollover
A profile built on an expiring futures contract can become less representative as volume migrates to the next expiration. Verify current participation before interpreting the structure.
Pros and Limitations of Futures Market Profile
Pros
- Shows time spent at price rather than only sequential candles.
- Creates repeatable references such as POC, VAH, VAL and Initial Balance.
- Makes single prints and unfinished-looking extremes easy to visualize.
- Helps distinguish balance from directional range expansion.
- Can be paired with Volume Profile for additional context.
- Works across many liquid futures markets.
Limitations
- Results depend on session and profile settings.
- Does not measure live bid/ask depth by itself.
- Does not guarantee support, resistance or direction.
- Different platforms can calculate or display levels differently.
- Profile interpretation can become subjective without fixed rules.
- Does not replace position sizing or execution analysis.
Who Is Futures Market Profile Best For?
Futures Market Profile is most useful for traders who want to understand how a session develops around acceptance and rejection rather than relying only on conventional indicators. It can be especially useful for active ES, NQ, RTY, CL, GC and other liquid futures traders who already understand contract specifications, rollover, tick value, and basic order execution.
It is less suitable as a plug-and-play entry system. A trader who does not understand the underlying contract, session structure, or risk per tick can easily turn sophisticated profile labels into false precision. Learn the instrument first, then use the profile as a structural layer.
For broader platform comparisons, see our Best Futures Trading Platforms 2026 guide.
Futures Market Profile FAQ
What is Futures Market Profile?
Futures Market Profile is a time-at-price framework that uses TPO blocks to show where price spent time during a selected profile period. It helps visualize value, balance, range extension, and areas of limited time acceptance.
What does TPO mean?
TPO stands for Time Price Opportunity. A block or letter indicates that a price row was visited during a specific time bracket.
What is the POC in Market Profile?
The TPO Point of Control is the price row with the greatest concentration of TPO blocks. It can differ from the POC produced by Volume Profile.
What are VAH and VAL?
VAH and VAL are the upper and lower boundaries of the calculated value area. TradingView’s TPO indicator uses a configurable value-area percentage and documents 70% as its default.
What is the Initial Balance?
The Initial Balance is the early-session range formed by the first configured time blocks. With two 30-minute blocks, this corresponds to the first hour, but platform settings can change the definition.
What are single prints?
Single prints are non-extreme profile rows containing only one TPO block. They show that price passed through that row during only one time bracket in the selected profile period.
What is a poor high or poor low?
A poor high or low is an extreme that lacks a clean taper or rejection and contains multiple TPO blocks at the edge. It can suggest an unfinished-looking auction, but it does not guarantee that price will extend beyond it later.
Is Market Profile the same as Volume Profile?
No. Futures Market Profile measures time-at-price using TPOs. Volume Profile measures traded volume at price. Their POC and value levels can align or diverge.
Does Market Profile predict price direction?
No. It organizes market structure and can help form hypotheses about acceptance, rejection, balance and range extension. It cannot guarantee the next direction or remove trading risk.
Final Verdict: How to Use Futures Market Profile Correctly
Futures Market Profile is valuable because it transforms a trading session into a map of time and price. TPO blocks show where the market repeatedly spent time, the POC identifies the strongest time concentration, VAH and VAL frame the main value region, and the Initial Balance gives traders an early-session reference for later range development.
The strongest process is not to memorize a list of profile patterns. It is to define the contract, session, TPO block size, row size, and value-area settings before the market develops; compare the current session with prior structure; then confirm the interpretation with volume, liquidity, volatility, and risk controls.
Used that way, Market Profile becomes a disciplined framework for describing the auction rather than a collection of supposedly magical levels.
Explore NinjaTrader for futures market analysis, simulation and execution tools
Affiliate Disclosure: TradeboticsAI may receive compensation when eligible users complete a qualifying action through certain affiliate links. Affiliate relationships do not determine our editorial conclusions.
Risk Disclosure: Futures trading involves substantial risk of loss and is not suitable for every investor. Market Profile, TPO, POC, value-area levels, Initial Balance, single prints and historical profile structures do not predict future returns. Simulated and backtested results are hypothetical and do not guarantee future performance. Nothing on this page is personalized investment, financial, tax or trading advice.