Contango and Backwardation 2026: Futures Curve, Roll Yield & Examples
Contango and Backwardation describe the shape of a futures market across different expiration dates. In simple terms, contango means later-dated futures trade above nearer contracts or spot, while backwardation means nearer contracts or spot trade above later-dated futures. The distinction matters because the curve can affect rollover economics, hedging decisions, commodity exposure, and the difference between a futures return and a simple spot-price chart.
Quick Answer
Contango and Backwardation are two common futures-curve structures. Contango is an upward-sloping curve in which deferred contracts are more expensive than nearby contracts. Backwardation is a downward-sloping curve in which nearby contracts are more expensive than deferred contracts. For long positions that must be rolled, contango can create a roll headwind while backwardation can create a roll tailwind, but neither structure guarantees the direction of the underlying market or the final trading result.
Explore NinjaTrader for futures charts, simulation and contract analysis
Affiliate Disclosure: TradeboticsAI may earn compensation when an eligible user completes a qualifying action through an affiliate link, at no additional cost to the user. Affiliate relationships do not determine our editorial conclusions.
Contango and Backwardation: What Do They Mean?
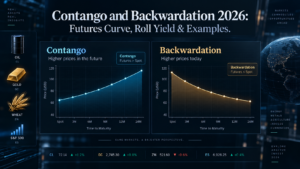
Contango and Backwardation describe relationships between prices for the same underlying market across time. CME Group explains contango as a structure in which futures prices are higher than spot or nearby prices, creating an upward-sloping curve. Backwardation is the opposite structure: the spot or nearby price is higher than later futures prices, creating a downward-sloping or inverted curve.
| Feature | Contango | Backwardation |
|---|---|---|
| Curve shape | Generally upward sloping | Generally downward sloping |
| Deferred vs nearby | Deferred contract priced higher | Deferred contract priced lower |
| Common commodity driver | Storage, insurance, financing, abundant inventory | Scarcity, strong immediate demand, high convenience yield |
| Typical long-roll effect | Potential headwind | Potential tailwind |
| Directional forecast? | No | No |
The last row is crucial. Contango and Backwardation describe curve structure, not a guaranteed prediction of where the market will trade next. A market can rise while in contango, fall while in backwardation, or flip between structures as inventories, interest rates, supply, demand, seasonality, and risk premiums change.
Official reference: CME Group: What Is Contango and Backwardation?
Spot Basis vs Futures-Curve Slope: A Useful Distinction
One reason Contango and Backwardation can become confusing is that the terms are used in two related ways. Some educational material compares the futures price directly with spot. Traders also use the terms to describe the slope between two futures expirations, such as the front month and the next month.
Basis is commonly expressed as:
Basis = Futures Price − Spot Price
If WTI spot is $78.00 and a futures contract trades at $79.20, that contract has a $1.20 premium to spot under this convention. By contrast, an inter-month curve calculation compares two futures expirations:
Calendar Spread = Far-Month Futures − Near-Month Futures
If the near contract is $78.00 and the next contract is $79.20, the spread is +$1.20 and that segment of the curve is in contango. If the next contract is $76.80, the spread is −$1.20 and that segment is in backwardation.
This distinction gives Contango and Backwardation more precision. A full futures curve can even contain both structures at different maturities. The front-to-second-month segment might slope upward while a farther portion slopes downward. For serious analysis, identify the exact contracts and timestamp instead of relying only on a generic label.

How to Read Contango and Backwardation on a Futures Curve
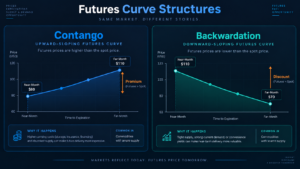
A futures curve plots contract prices vertically against expiration dates horizontally. Consider two hypothetical WTI futures curves observed at the same time.
| Expiration | Contango Example | Backwardation Example |
|---|---|---|
| Front Month | $80.00 | $80.00 |
| Month 2 | $80.60 | $79.40 |
| Month 3 | $81.10 | $78.90 |
| Month 4 | $81.55 | $78.45 |
In the first example, each later contract costs more than the preceding contract. In the second, later contracts become cheaper. This is the visual core of Contango and Backwardation.
TradeboticsAI uses a simple curve-slope check for two adjacent contracts:
Curve Spread % = (Far Contract − Near Contract) ÷ Near Contract × 100
Using $80.00 and $80.60 produces +0.75%. Using $80.00 and $79.40 produces −0.75%. The sign identifies the direction of that segment, but it does not forecast the next price move or guarantee a roll return.
Why Contango and Backwardation Exist: Cost of Carry
For storable commodities, Contango and Backwardation can often be understood through cost of carry. Holding physical inventory has economic costs: financing, storage, insurance, handling and sometimes transportation. If those costs dominate, a later futures price can reasonably trade above the current cash price.
A simplified commodity pricing framework is:
F ≈ S × e(r + u − y)T
Where F is the futures price, S is spot price, r is financing cost, u represents storage and related carrying costs, y is convenience yield, and T is time to expiration.
Convenience yield is the economic benefit of having the physical commodity available now. A refinery may value immediate crude oil inventory because running out could interrupt production. When inventories are tight, the value of immediate ownership can rise enough to push nearby prices above deferred prices, contributing to backwardation.
CME Group notes that convenience yield tends to be higher when warehouse stocks are low and lower when inventories are abundant. That relationship explains why Contango and Backwardation can contain useful information about physical supply conditions without being a simple directional trading signal.
Financial Futures Are Different
The same terminology can be applied to term structures beyond physical commodities, but the economics differ. Equity-index futures, for example, are strongly influenced by financing rates and expected dividends rather than warehouse storage. A simplified equity-index fair-value relationship is often written using interest rates minus dividend yield. Traders should therefore avoid applying a crude-oil storage explanation mechanically to ES, NQ, currencies, rates or crypto futures.
For tick size, contract value and settlement mechanics, see our Futures Contract Specifications 2026 guide.
Contango and Backwardation: How Roll Yield Works
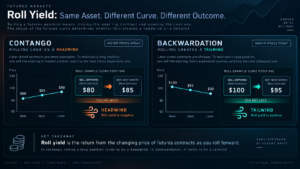
Roll yield becomes important when a trader or fund maintains futures exposure beyond the life of one contract. Because futures expire, the position must eventually be closed, settled or rolled into another expiration.
In a contango example, suppose the expiring contract trades at $80 and the next contract trades at $81. A long trader closing the $80 contract and buying the $81 contract is moving into a more expensive contract. If that curve relationship persists and the position is repeatedly rolled, the structure can create a performance headwind.
In backwardation, suppose the near contract is $80 and the next contract is $79. A long trader moving into the cheaper deferred contract can receive a structural tailwind relative to the same rolling process. This is why Contango and Backwardation matter to commodity funds, systematic strategies and traders holding exposure across expirations.
Another common mistake is treating the price gap paid during a roll as an immediate cash loss equal to the full spread. The new futures contract is a different instrument with a different expiration and price. The economically relevant effect emerges through the subsequent behavior of the contract, convergence and the repeated rolling process.
For the mechanics of changing expiration months, see our Futures Rollover Dates 2026 guide.
Explore NinjaTrader for futures charting, contract selection and simulated trading
How Contango and Backwardation Differ Across Futures Markets
Contango and Backwardation should always be interpreted in the context of the underlying market. Storage-intensive commodities, seasonal agricultural products, energy markets and financial futures can develop different curve structures for different reasons.
| Market | Important Curve Drivers | Special Consideration |
|---|---|---|
| WTI Crude Oil | Inventories, storage, supply disruption, refinery demand, geopolitics | Physical-delivery economics strongly affect nearby spreads |
| Natural Gas | Seasonality, weather, storage injections/withdrawals, production | Curve can vary sharply across seasonal months |
| Gold | Interest rates, financing, storage, monetary demand | Cost of carry often matters more than scarcity premiums |
| Corn/Soybeans | Harvest cycles, inventories, weather, export demand | New-crop and old-crop months can behave differently |
| Equity Index | Interest rates, dividends, time to expiration | Physical storage explanations do not apply |
| Bitcoin | Financing, leverage demand, sentiment, institutional positioning | Cash-settled futures can show term premiums without storage costs |
The table shows why one universal rule for Contango and Backwardation is unreliable. The same curve shape can emerge from different economic mechanisms, so serious analysis starts with the specific market rather than the label alone.
2026 WTI Example: Why Backwardation Can Become Extreme
A useful current-year case comes from CME Group research published in 2026. During a major oil supply disruption earlier in the year, the WTI futures curve moved into steep backwardation, with nearby contracts trading substantially above deferred contracts. CME’s analysis linked the shape to near-term scarcity and disruption while later contracts reflected expectations that supply conditions could normalize.
The lesson is not that backwardation guarantees rising oil. CME explicitly cautioned that long positions can still lose money if disruptions resolve and prices fall. Instead, the example shows how Contango and Backwardation can encode a difference between immediate scarcity and longer-term expectations.
The same CME research also highlights roll economics: historically, long crude-oil exposure has often experienced a structural tailwind during backwardated periods and a headwind during contango periods, but there are important exceptions. Historical relationships are not guarantees of future performance.
Read the official research: CME Group: Implications of WTI Oil Futures in Backwardation.
Contango, Backwardation and Convergence at Expiration
Another foundation of Contango and Backwardation is convergence. CME explains that as a futures contract approaches maturity, the futures price and the relevant spot or cash price should converge, otherwise an arbitrage opportunity could exist.
This does not mean the spot price must stay still while the futures price mechanically moves toward it. Spot can rise, futures can fall, both can move, or market conditions can change the entire curve. Convergence describes the relationship as settlement approaches, not a guaranteed path.
The same principle helps explain why continuous futures charts can differ from the experience of holding and rolling actual contracts. A continuous chart stitches expirations together for analysis. A real trader must exit or settle one contract and enter another, potentially at a different price.
For open-interest migration between expirations, see Futures Open Interest 2026.
A Practical Contango and Backwardation Analysis Workflow
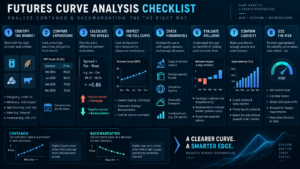
Use this workflow before drawing conclusions from a futures curve:
- Identify the exact market. Do not mix different grades, locations, multipliers or settlement methods.
- Select comparable expirations. Compare actively traded contracts and note whether a contract is close to expiration or first notice procedures.
- Record the same timestamp. Comparing prices from different times can create a false curve.
- Calculate the spread. Use far minus near consistently and document the sign convention.
- Inspect the full curve. One segment can be in contango while another is backwardated.
- Check fundamental drivers. Inventory, storage, seasonality, rates, dividends, supply and demand can matter.
- Evaluate rollover. Determine whether the curve creates a potential structural headwind or tailwind for your holding period.
- Check liquidity. Volume, open interest, spread and depth matter before executing any roll.
- Separate structure from forecast. Do not assume an upward curve means price must rise or a downward curve means it must fall.
- Size risk independently. Curve analysis does not replace stops, position sizing or margin planning.
Contango and Backwardation become far more useful when treated as market-structure data rather than standalone signals. For platform comparisons involving charting, execution, simulation and market analysis, see our Best Futures Trading Platforms 2026 guide.
Common Contango and Backwardation Mistakes
1. Treating Curve Shape as a Price Forecast
Contango does not mean the market must rise, and backwardation does not mean it must fall. Curve structure reflects current pricing relationships across maturities.
2. Comparing Non-Equivalent Contracts
Different grades, delivery locations, settlement rules or thin expirations can distort the analysis. Contango and Backwardation should be measured across comparable contracts.
3. Assuming Roll Yield Equals the Spread Paid Today
A roll moves exposure from one contract to another. Realized performance depends on subsequent price behavior, convergence, execution costs and the chosen rolling methodology.
4. Ignoring Seasonality
Natural gas, grains and other seasonal markets can have curves that look unusual when viewed without knowledge of demand and supply cycles.
5. Looking Only at the Front Two Contracts
A curve can be mixed. Analyzing several expirations can reveal whether the structure is local to the nearby market or extends farther forward.
6. Ignoring Rollover Liquidity
The theoretically attractive contract may not be the best execution choice if spreads are wide or market depth is thin. Verify live conditions before trading.
Pros and Limitations of Futures-Curve Analysis
Pros
- Shows pricing relationships across expiration months.
- Provides context on inventory and immediate scarcity.
- Helps explain roll economics.
- Useful for commodity hedgers and systematic strategies.
- Can reveal seasonal or supply-driven market structure.
- Adds information beyond a single front-month chart.
Limitations
- Not a guaranteed directional signal.
- Curve shape can change rapidly.
- Drivers differ across asset classes.
- Thin contracts can distort the apparent curve.
- Roll yield depends on methodology and future price changes.
- Does not replace execution or risk analysis.
Who Should Use This Guide?
This Contango and Backwardation guide is useful for commodity traders, futures investors, systematic traders, hedgers, analysts and anyone who rolls futures exposure from one expiration to another. It is especially relevant for energy, metals and agricultural markets where storage, inventory and seasonality can strongly influence the curve.
It is less useful when treated as a mechanical buy/sell system. Traders still need contract specifications, current liquidity, margin information, position sizing and an understanding of the underlying market.
Contango and Backwardation FAQ
What is contango in futures?
Contango is a futures-curve structure in which deferred contracts generally trade above nearby contracts or spot. For storable commodities, financing, storage and insurance can contribute to this upward slope.
What is backwardation in futures?
Backwardation is a structure in which nearby futures or spot trade above later-dated contracts. In physical commodities, scarcity and high convenience yield can contribute to this inverted curve.
Is contango bullish or bearish?
Neither by definition. Contango and Backwardation describe relative pricing across maturities, not guaranteed future direction. A market can rise or fall under either structure.
Why can contango hurt a long futures strategy?
If a long strategy repeatedly sells a cheaper expiring contract and buys a more expensive deferred contract, the structure can create a roll headwind. Actual results still depend on price changes, convergence and execution costs.
Why can backwardation help a long rolling strategy?
A long strategy may sell a higher-priced nearby contract and move into a lower-priced deferred contract, creating a potential roll tailwind. It is not guaranteed profit because the market and curve can move afterward.
Do futures prices always converge with spot?
As expiration approaches, the futures and relevant cash price should converge under normal market mechanics. Both prices can move during the process, so convergence does not imply a fixed path.
Can one futures curve have both contango and backwardation?
Yes. Different segments can slope in different directions. That is why Contango and Backwardation should be measured between explicitly identified expiration months.
Where can I see a futures curve?
Exchange product pages, professional market-data platforms and many futures trading platforms provide prices across contract months. Compare contracts using the same timestamp and confirm liquidity before drawing conclusions.
Final Verdict: How to Use Contango and Backwardation Correctly
Contango and Backwardation are best viewed as a map of futures pricing across time. They can reveal the influence of carry costs, inventory, scarcity, seasonality, financing and market expectations, while also helping traders understand why rolling futures exposure can perform differently from simply tracking a spot-price chart.
The strongest analysis identifies the exact contracts, measures the curve consistently, checks liquidity and fundamentals, and separates roll economics from directional prediction. Contango can create a headwind for a continuously rolled long position; backwardation can create a tailwind. Neither condition eliminates price risk.
Use the curve as context, not as a promise. Combine it with contract specifications, rollover timing, open interest, live execution conditions and disciplined position sizing.
Explore NinjaTrader for futures market analysis, simulation and execution tools
Affiliate Disclosure: TradeboticsAI may receive compensation when eligible users complete a qualifying action through certain affiliate links. Affiliate relationships do not determine our editorial conclusions.
Risk Disclosure: Futures trading involves substantial risk of loss and is not suitable for every investor. Futures are leveraged instruments. Curve structure, basis, roll yield and historical relationships do not predict future returns. Examples on this page are educational and hypothetical. Simulated and backtested results do not guarantee future performance. Nothing on this page is personalized investment, financial, tax or trading advice.