Futures Open Interest 2026: How to Read OI, Volume & Price
Futures Open Interest measures the number of futures contracts that remain open after positions have been created and before they are offset, delivered, or otherwise closed. Unlike trading volume, which counts contracts traded during a period, open interest tracks outstanding positions. Used correctly, it can help traders evaluate participation, liquidity, contract rollover, and whether a price trend is attracting or losing participation.
Quick Answer
Futures Open Interest is the total number of outstanding futures contracts in a market or delivery month that have not yet been offset or fulfilled. Volume answers “how much traded today?” while open interest answers “how many contracts remain open?” Rising open interest can show growing participation, but it is not automatically bullish or bearish. The most useful analysis combines price, volume, open interest, liquidity, and contract-specific context.
Explore NinjaTrader for futures charts, simulation and market analysis tools
Affiliate Disclosure: TradeboticsAI may earn compensation when an eligible user completes a qualifying action through an affiliate link, at no additional cost to the user. Affiliate relationships do not determine our editorial conclusions.

What Is Futures Open Interest?
The CFTC defines open interest as the total number of futures contracts, long or short, in a delivery month or market that have been entered into and not yet liquidated by an offsetting transaction or fulfilled by delivery. CME Group uses the same core concept: each open contract has a buyer and seller, but for calculating open interest, the contract is counted once rather than twice.
Futures Open Interest therefore represents outstanding contractual exposure, not the number of individual traders and not the amount of money invested. If one participant is long one ES contract and another participant is short the same contract, that pairing creates one open contract.
This matters because futures markets are structurally different from stocks. A company normally has a known number of shares outstanding. A futures market can create new contracts when new long and short positions meet, and those contracts can disappear when offsetting positions are closed.
Learn more from
CME Group’s official open interest education
and the
CFTC futures glossary.
Futures Open Interest vs Volume: The Difference
The most important distinction is simple: volume measures transactions; open interest measures positions that remain open. A contract can trade many times during one session and contribute repeatedly to volume, while the net number of outstanding contracts may change very little.
| Metric | What It Measures | Typical Update | Best Use |
|---|---|---|---|
| Volume | Contracts traded during a selected period | Intraday and daily | Activity, execution and participation |
| Open Interest | Contracts still outstanding | Typically end-of-day reporting | Position buildup, trend context and rollover analysis |
CME explains that daily volume counts contracts traded across its venues, while open interest represents contracts that remain entered and have not yet been offset or fulfilled. This means high volume can occur with flat or falling open interest if existing participants are rapidly transferring or closing positions.
Futures Open Interest is therefore not a substitute for volume. The two statistics answer different questions and become more useful when read together.

How Open Interest Increases, Falls or Stays Unchanged
The direction of Futures Open Interest depends on whether participants are opening or closing positions. The exchange and clearing system see both sides of each transaction, so the effect on outstanding contracts depends on the status of the buyer and seller.
| Buyer | Seller | Effect on Open Interest | Why |
|---|---|---|---|
| Opens new long | Opens new short | +1 | A new contract is created |
| Closes existing short | Closes existing long | -1 | An existing contract is removed |
| Opens | Closes | 0 | Ownership/exposure is transferred |
Example: suppose open interest is 100,000 contracts. If 2,000 new long-short pairs are created and no other positions are closed, the total becomes 102,000. If later 3,500 existing contract pairs are offset, it falls to 98,500, assuming no other changes.
The crucial point is that rising open interest does not reveal whether “buyers” or “sellers” are winning. Every futures contract has both a long and a short side. Price action and participant data are needed to interpret the context.
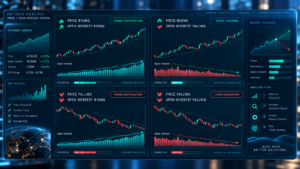
Futures Open Interest Interpretation Matrix: Price + Volume + OI
A common way to organize Futures Open Interest is to compare its direction with price and volume. This is an analytical framework, not a mechanical trading signal. The same combination can mean different things around news, expiration, seasonal hedging or a contract roll.
| Price | Open Interest | Possible Interpretation | What to Verify |
|---|---|---|---|
| Rising | Rising | Participation is expanding alongside the advance | Volume, news catalyst, resistance and roll effects |
| Rising | Falling | Advance may be driven partly by position reduction or short covering | Whether the market is near expiration or after a squeeze |
| Falling | Rising | New exposure is being added while price declines | Trend structure, hedging flows and COT context |
| Falling | Falling | Participants may be reducing exposure | Expiration, liquidation and liquidity conditions |
This matrix is deliberately cautious. A simple “price up + OI up = bullish” rule is too crude for serious analysis. The same open-interest change can be generated by speculators, hedgers, funds or market participants with very different objectives.
For trend analysis, use Futures Open Interest as confirmation or context rather than as a standalone trigger. Price structure, volatility, order-book conditions and risk management still determine whether a trade setup is appropriate.
Does Futures Open Interest Measure Liquidity?
Futures Open Interest can contribute to a liquidity assessment, but it does not directly tell you the bid/ask spread, available depth at the current price, or how much slippage an order will experience. A contract can have substantial outstanding exposure and still be temporarily thin at a specific moment.
CME trader education recommends evaluating liquidity through factors such as the bid-offer spread, orders resting at bid and offer levels, and the frequency of transactions. Volume and open interest add useful context, especially when comparing contracts or delivery months.
- Current bid/ask spread.
- Market depth.
- Recent transaction frequency.
- Current and average volume.
- Open interest.
- Time of day.
- Scheduled economic releases.
- Contract month and proximity to rollover.
Use our Futures Contract Specifications 2026 guide to verify tick size and tick value before translating liquidity or slippage into dollar risk.
Open Interest During Futures Contract Rollover
Rollover is one of the best real-world uses of Futures Open Interest. As a futures contract approaches expiration, traders may close positions in the expiring month and establish positions in the next month. As that migration occurs, open interest in the old contract can decline while open interest in the next contract rises.
This is why a sudden decline in one expiration’s open interest should not automatically be interpreted as traders abandoning the underlying market. Exposure may simply be migrating into the next delivery month.
A better rollover process compares both expirations using volume, open interest, spread and depth. For ES, NQ, MES and MNQ, our Futures Rollover Dates 2026 calendar explains the quarterly H-M-U-Z cycle and the difference between a customary roll date and actual liquidity migration.
When using continuous futures charts, remember that the back-adjusted or stitched series is an analytical construction. Live orders must still be placed in a specific tradable contract month.

Futures Open Interest and the CFTC Commitments of Traders Report
The CFTC’s Commitments of Traders reports provide another layer of Futures Open Interest analysis. The CFTC publishes breakdowns of open interest for qualifying futures and options markets to help the public understand market dynamics.
The main COT formats include Legacy, Disaggregated and Traders in Financial Futures reports. Depending on the market, categories can include commercial and non-commercial traders, producers and merchants, swap dealers, managed money, dealers, asset managers, leveraged funds and other reportables.
For example, an increase in total open interest becomes more informative when a trader also understands which participant categories are building positions. However, COT data are aggregated and delayed relative to live trading, so they should not be treated as an intraday timing tool.
Official methodology and reports are available through the
CFTC Commitments of Traders portal.
The CFTC also explains that aggregate long open interest equals aggregate short open interest, reinforcing why total OI is not inherently bullish or bearish.
A Practical Futures Open Interest Analysis Workflow
Use this workflow to avoid turning Futures Open Interest into an oversimplified indicator:
- Identify the exact contract month. OI is contract-specific, so distinguish ESU26 from ESZ26 rather than looking only at the root symbol.
- Check price structure. Determine whether the market is trending, ranging, breaking out or reversing.
- Compare current volume. Higher participation can provide useful context around a price move.
- Check the change in OI. Focus on direction and magnitude rather than one isolated number.
- Check rollover context. Declining front-month OI near expiration can represent normal migration.
- Review liquidity directly. Observe spread, depth and actual execution conditions.
- Add COT context when relevant. Weekly positioning can help with broader structure, not scalping decisions.
- Size the trade independently. OI does not define a safe stop or position size.
Explore NinjaTrader for futures charts, simulation and contract analysis
Common Open Interest Mistakes
1. Treating Rising OI as Automatically Bullish
Every open futures contract has both a long and a short side. More outstanding contracts mean more exposure exists, not that buyers mathematically outnumber sellers.
2. Confusing OI With Volume
Volume can reset for a new session while open interest carries forward as outstanding exposure. A highly active session does not necessarily create a large increase in OI.
3. Ignoring Contract Month
Futures Open Interest can shift sharply around rollover. Looking at only the expiring month can create a false impression that participation is disappearing from the entire market.
4. Using End-of-Day Data as a Live Signal
Official open-interest data are generally reported after the trading session. It is useful for context, but it is not the same as a real-time order-flow measure.
5. Assuming High OI Guarantees Easy Execution
Execution depends on the live order book, spread, volatility and order size. OI alone cannot predict slippage.

Pros and Limitations of Futures Open Interest
Pros
- Measures outstanding contractual exposure.
- Adds context to price and volume analysis.
- Useful for comparing contract months.
- Helps interpret rollover and liquidity migration.
- Connects naturally with CFTC positioning data.
- Available from official exchange reporting.
Limitations
- Not inherently bullish or bearish.
- Usually not a real-time timing signal.
- Does not identify every participant’s motive.
- Does not measure spread or market depth directly.
- Can be distorted by rollover if contract months are ignored.
- Should not replace price-based risk management.
Where to Find Official Futures Open Interest Data
CME Group publishes daily volume and open-interest reports for futures and options. CME notes that its end-of-day Daily Volume and Open Interest Report is preliminary, while official figures are released through the Daily Bulletin afterward. That distinction matters when exact historical figures are required.
Use the
CME Group Volume & Open Interest reports
for exchange data and the CFTC portal for weekly participant-category analysis. Platform data can be convenient for charting, but official sources should be the reference when a precise historical figure matters.
If you are choosing software for futures analysis, compare charting, market data, execution, simulation and automation features in our Best Futures Trading Platforms 2026 guide.
Futures Open Interest FAQ
What does futures open interest mean?
Futures Open Interest is the number of outstanding futures contracts that have been entered into and have not yet been offset, fulfilled by delivery or otherwise closed. Each contract has a long and a short side, but it is counted once in total open interest.
Is high open interest bullish?
No. High or rising open interest shows that more outstanding exposure exists, but it does not indicate direction by itself. Price action, volume, participant positioning and market context are needed.
What is the difference between volume and open interest?
Volume counts contracts traded during a selected period. Open interest counts contracts that remain outstanding. A contract can trade multiple times and increase volume without producing the same change in open interest.
Does open interest reset every day?
No. Trading volume is commonly viewed on a daily basis, while open interest carries forward because it represents positions that remain open. It changes as new contracts are created and existing contracts are offset or fulfilled.
Why does open interest fall near futures expiration?
Traders may close the expiring contract or roll exposure into the next month. Falling OI in one expiration can therefore coincide with rising OI in the next contract rather than a loss of interest in the underlying market.
Can open interest be used for day trading?
It can provide broader context, but official OI is generally not a real-time intraday signal. Day traders should prioritize live price, volume, spread, depth, volatility and risk controls.
Where can I find futures open interest data?
Official sources include CME Group’s Volume & Open Interest reports and the CFTC’s Commitments of Traders reports. Many trading platforms also display exchange-provided OI data.
Final Verdict: How to Use Futures Open Interest Correctly
Futures Open Interest is most valuable when it answers a specific question: is outstanding exposure building, shrinking, or migrating between contracts? It becomes much less useful when treated as a standalone bullish or bearish indicator.
The strongest process combines OI with price, volume, liquidity, contract expiration and participant context. During rollover, compare both the expiring and next contracts. For trend analysis, use OI as confirmation rather than prediction. For execution, prioritize spread, depth and real-time market conditions.
In short, open interest is a market-structure tool. Used with discipline, it can improve the way traders interpret participation without pretending to forecast the future.
Explore NinjaTrader for futures market analysis, simulation and execution tools
Affiliate Disclosure: TradeboticsAI may receive compensation when eligible users complete a qualifying action through certain affiliate links. Affiliate relationships do not determine our editorial conclusions.
Risk Disclosure: Futures trading involves substantial risk of loss and is not suitable for every investor. Futures are leveraged instruments. Open interest, volume, COT positioning and historical relationships do not predict future price movement. Simulated and backtested results are hypothetical and do not guarantee future performance. Nothing on this page is personalized investment, financial, tax or trading advice.