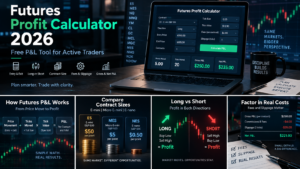
Futures Profit Calculator 2026: Free P&L Tool
Use this futures profit calculator to estimate the gross and net profit or loss of a futures trade from entry price, exit price, direction, contract quantity, tick size and tick value. Select a preset for popular contracts such as ES, MES, NQ, MNQ, CL or GC, or use a custom contract when you need different specifications.
The futures profit calculator also includes optional round-turn fees and estimated slippage so you can compare the theoretical price-move result with a more conservative net estimate. It works for both long and short trades and shows points moved, ticks moved, P&L per contract, gross P&L and estimated net P&L.
Quick Answer
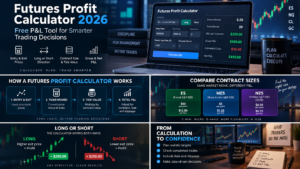
A futures profit calculator converts the price move between entry and exit into ticks, multiplies those ticks by the contract’s dollar tick value, adjusts for long or short direction, and multiplies by the number of contracts. For a long position, a higher exit creates positive gross P&L; for a short position, a lower exit creates positive gross P&L. Fees and slippage can then be subtracted to produce an estimated net result.
Affiliate Disclosure: TradeboticsAI may receive compensation when readers complete qualifying actions through certain links. NinjaTrader buttons on this page are affiliate links. Calculator outputs and editorial explanations do not change based on compensation.
Futures Profit Calculator
This interactive futures profit calculator is designed for quick what-if analysis and post-trade checking. Choose a contract, direction and number of contracts, then enter the actual or hypothetical entry and exit prices. Optional fee and slippage fields let you estimate the difference between theoretical gross P&L and a more realistic net figure.
Calculate Futures Profit or Loss
Educational estimate only. Actual commissions, exchange fees, routing charges and fills vary. Slippage is entered as an estimate and is not a prediction. Verify current contract specifications and your broker statement.
How the Futures Profit Calculator Works
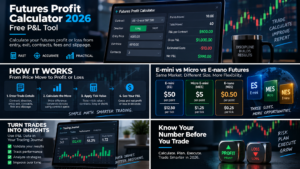
The futures profit calculator starts with the difference between your entry and exit prices. That price difference is divided by the contract’s minimum tick size to determine how many ticks the market moved. The tool then multiplies the signed tick count by the dollar value of one tick and by the number of contracts.
Direction changes the sign of the calculation. If you are long, an exit above the entry is positive and an exit below the entry is negative. If you are short, the relationship is reversed. This makes the same calculator useful for profit targets, stop-loss scenarios and checking completed trades.
Unlike a stock calculation, the raw price change alone does not tell you the dollar outcome. Futures contracts use specific multipliers, tick sizes and tick values. Five index points in ES and five index points in MES represent very different dollar amounts even though both contracts track the S&P 500.
Futures Profit Calculator Formula
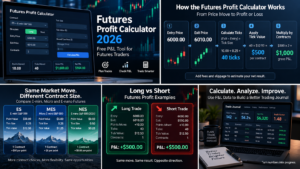
The core futures profit calculator formula can be written in ticks:
Ticks moved = (exit price − entry price) ÷ tick size
For a long trade:
Gross P&L = ticks moved × tick value × contracts
For a short trade, multiply the result by -1, or reverse entry and exit in the first step.
The tool’s estimated net figure uses:
Estimated net P&L = gross P&L − round-turn fees − estimated slippage cost
Estimated slippage cost is calculated as the slippage input in ticks multiplied by tick value and contract quantity. This is a planning adjustment only. If you are checking a completed trade with exact fill prices, some slippage is already reflected in those fills, so avoid subtracting the same cost twice.
The futures profit calculator does not use leverage or margin to determine P&L. A contract’s profit or loss comes from its price movement and contract specification. Margin determines the collateral needed to carry the position under the relevant broker or clearing rules; it does not change the contract’s tick value.
Contract Tick and Point Values Used by the Futures Profit Calculator
The preset list covers widely traded U.S. equity-index, energy and metals futures. Point value equals tick value divided by tick size. For example, ES has a 0.25-point minimum tick worth $12.50, so a full index point is worth $50 per contract. MES also moves in 0.25-point ticks, but each tick is $1.25 and each full point is $5.
| Symbol | Contract | Tick Size | Tick Value | Point Value |
|---|---|---|---|---|
| ES | E-mini S&P 500 | 0.25 | $12.50 | $50.00 |
| MES | Micro E-mini S&P 500 | 0.25 | $1.25 | $5.00 |
| NQ | E-mini Nasdaq-100 | 0.25 | $5.00 | $20.00 |
| MNQ | Micro E-mini Nasdaq-100 | 0.25 | $0.50 | $2.00 |
| YM | E-mini Dow | 1.00 | $5.00 | $5.00 |
| MYM | Micro E-mini Dow | 1.00 | $0.50 | $0.50 |
| RTY | E-mini Russell 2000 | 0.10 | $5.00 | $50.00 |
| M2K | Micro E-mini Russell 2000 | 0.10 | $0.50 | $5.00 |
| CL | WTI Crude Oil | 0.01 | $10.00 | $1,000.00 |
| MCL | Micro WTI Crude Oil | 0.01 | $1.00 | $100.00 |
| GC | Gold | 0.10 | $10.00 | $100.00 |
| MGC | Micro Gold | 0.10 | $1.00 | $10.00 |
CME Group confirms that MES uses a 0.25-point tick worth $1.25 and MNQ uses a 0.25-point tick worth $0.50. CME also lists MCL at $1 per 0.01 tick compared with $10 for the standard CL contract. Gold futures use a $10 minimum tick for GC and $1 for Micro Gold.
Contract specifications should always be rechecked before live use. A futures profit calculator can only be as accurate as the tick size and tick value supplied to it.
2026 Update: E-nano Contracts in the Futures Profit Calculator
A major 2026 update is the launch of CME Group’s E-nano Equity Index futures. CME announced the new suite for August 24, 2026, and the contracts are now listed as live products. They are one-tenth the size of the corresponding Micro E-mini contracts and one-hundredth the size of the traditional E-mini suite.
Our futures profit calculator includes presets for all four new E-nano equity-index contracts:
| Symbol | E-nano Contract | Multiplier | Tick Size | Tick Value |
|---|---|---|---|---|
| NES | E-nano S&P 500 | $0.50/point | 0.50 | $0.25 |
| NNQ | E-nano Nasdaq-100 | $0.20/point | 0.50 | $0.10 |
| N2K | E-nano Russell 2000 | $0.50/point | 0.20 | $0.10 |
| NDOW | E-nano Dow | $0.05/point | 2.00 | $0.10 |
See the
official CME Group E-nano Equity Index futures FAQ
for current specifications.
This new contract tier is useful for calculator design because the same index movement can now be compared across E-mini, Micro E-mini and E-nano sizes. For the S&P 500, the point values are $50 for ES, $5 for MES and $0.50 for NES. For Nasdaq-100, they are $20 for NQ, $2 for MNQ and $0.20 for NNQ.
Futures Profit Calculator Examples
ES Example: Five-Point Long Trade
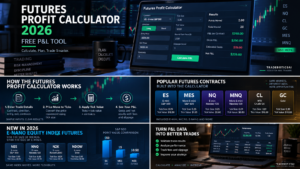
Suppose an ES long position enters at 6,000.00 and exits at 6,005.00. That is a five-point move. With ES worth $50 per point, the gross result is $250 per contract before fees and any additional cost estimate. The futures profit calculator reaches the same result by converting five points into 20 ticks and multiplying 20 by $12.50.
MNQ Example: 25-Point Short Trade
Assume MNQ is sold at 21,000 and bought back at 20,975. MNQ is worth $2 per point, so the 25-point favorable move equals $50 gross per contract. With three contracts, gross P&L is $150 before fees and slippage.
CL Example: $0.50 Price Move
CL represents 1,000 barrels and uses a $0.01 tick worth $10. A move from $70.00 to $70.50 is 50 ticks, so one long CL contract gains $500 gross. A short position over the same upward move would lose $500 gross.
NES Example: Ten-Point E-nano S&P Move
NES has a $0.50 point multiplier. A ten-point favorable move therefore represents $5 gross per contract. This example highlights why the futures profit calculator needs separate presets even when several contracts track the same index.
Gross vs Net Results in a Futures Profit Calculator
Gross P&L measures only the contract’s price movement. Net P&L attempts to account for trading costs. The difference matters most for high-frequency strategies, small targets and portfolios using many micro or nano contracts.
If one trade earns $100 gross but total round-turn fees and estimated slippage equal $18, the estimated net result is $82. Repeating that calculation over hundreds of trades can materially change strategy statistics, profit factor and expectancy.
The optional fee field in this futures profit calculator is entered per contract for the entire round trip. Enter the number relevant to your actual brokerage arrangement. Commissions, exchange fees, NFA fees, routing and other charges differ by broker and plan, so TradeboticsAI does not hard-code a universal fee.
Slippage also varies. Market orders, stop orders, liquidity, volatility, time of day and queue position can all affect execution. The calculator’s slippage field lets you model a chosen number of ticks; it does not predict what the market will actually deliver.
Futures Profit Calculator vs Position Size Calculator
These tools answer different questions. A futures profit calculator asks: “What is the dollar result of this entry-to-exit move for this number of contracts?” A position size calculator asks: “How many contracts fit inside a defined risk budget given my stop distance?”
Use the position-size tool before a trade when the objective is controlling planned loss. Use the P&L tool for target scenarios, completed-trade checking and understanding how contract choice changes the dollar effect of a price move.
For pre-trade sizing, use our
Futures Position Size Calculator 2026.
It calculates maximum whole-contract quantity from risk budget, stop distance and tick value.
Using Futures P&L Data in a Trading Journal
One useful role for a futures profit calculator is auditing your journal. If the broker statement, journal import and independent tick calculation disagree, investigate contract specification, quantity, direction, commissions, partial fills and whether the journal grouped executions correctly.
Do not judge a strategy from gross dollars alone. Normalize results by setup, contract, risk unit, time of day and account when possible. A strategy traded with ten micros can produce a similar directional exposure to one larger contract while generating a different fee structure.
Our
Best Futures Trading Journals 2026
guide compares tools for broker imports, drawdown, expectancy, MAE/MFE and multi-account review.
Common Futures P&L Calculation Mistakes
Using the Wrong Contract Size
ES, MES and NES can track the same underlying S&P 500 index but have point values of $50, $5 and $0.50 respectively. Selecting the wrong symbol can change the result by a factor of ten or one hundred.
Confusing Tick Size With Tick Value
Tick size is a price increment. Tick value is the dollar value of that increment. The futures profit calculator needs both numbers when converting price movement into P&L.
Forgetting Trade Direction
A falling market creates a loss for a long position and a gain for a short position. The direction selector exists so the sign is handled consistently.
Ignoring Quantity
P&L scales linearly with contract count before costs. A $100 per-contract result becomes $500 across five contracts.
Mixing Gross and Net Performance
Backtests and journals can look better when fees and realistic execution costs are excluded. Keep the assumptions explicit and compare like with like.
Assuming the Calculator Predicts a Fill
The futures profit calculator calculates from the prices you enter. It cannot guarantee that a limit, market, stop or target order will fill at a specific price.
Futures Profit Calculator FAQ
How do I calculate profit on a futures trade?
Subtract entry from exit, convert the price difference to ticks using the contract’s tick size, multiply by the dollar tick value and number of contracts, and adjust the sign for long or short direction. The futures profit calculator above performs those steps automatically.
How much is one ES point worth?
One ES point is $50 per contract. ES has four 0.25-point ticks per point, and each tick is worth $12.50.
How much is one NQ point worth?
One NQ point is $20 per contract. One MNQ point is $2. CME’s new E-nano Nasdaq-100 contract, NNQ, has a $0.20 point multiplier.
Can the calculator handle short futures trades?
Yes. Select Short and the tool reverses the sign of the entry-to-exit move so a lower exit produces positive gross P&L.
Does the futures profit calculator include commissions?
It includes an optional round-turn fee field per contract. Because actual commissions and exchange-related fees vary, enter the amount that matches the scenario you want to model.
Does this tool include slippage?
Yes, optionally. Enter estimated total slippage in ticks per contract. The resulting cost is deducted from gross P&L. This is an assumption, not a prediction of execution quality.
What are E-nano futures?
CME Group launched E-nano Equity Index futures in August 2026 for the S&P 500, Nasdaq-100, Russell 2000 and Dow. They are one-tenth the size of corresponding Micro E-mini contracts and one-hundredth the size of E-minis.
Is futures P&L the same as margin return?
No. Contract P&L is driven by price movement and the contract multiplier. Return on posted margin is a different ratio, and broker margin can change independently of the contract’s tick value.
Can I use the calculator for hypothetical targets and stops?
Yes. The futures profit calculator can be used for what-if analysis by entering hypothetical exit prices. The result remains an estimate and does not guarantee the order will fill at that level.
Final Verdict: Futures Profit Calculator for 2026
A reliable futures profit calculator should make the contract math transparent. Entry price, exit price, direction, tick size, tick value and quantity determine gross P&L. Fees and estimated slippage help bridge the gap between theoretical and net results.
TradeboticsAI’s 2026 version also includes CME’s newly launched E-nano equity-index futures alongside E-mini, Micro E-mini, energy and metals presets. That makes it possible to compare the same market move across multiple contract sizes without manually rebuilding the calculation.
Use the tool to check scenarios and completed trades, then use the separate position-size calculator to determine whether the planned quantity fits your risk budget before entry. Neither calculator predicts market direction, guarantees an order fill or guarantees a maximum loss.